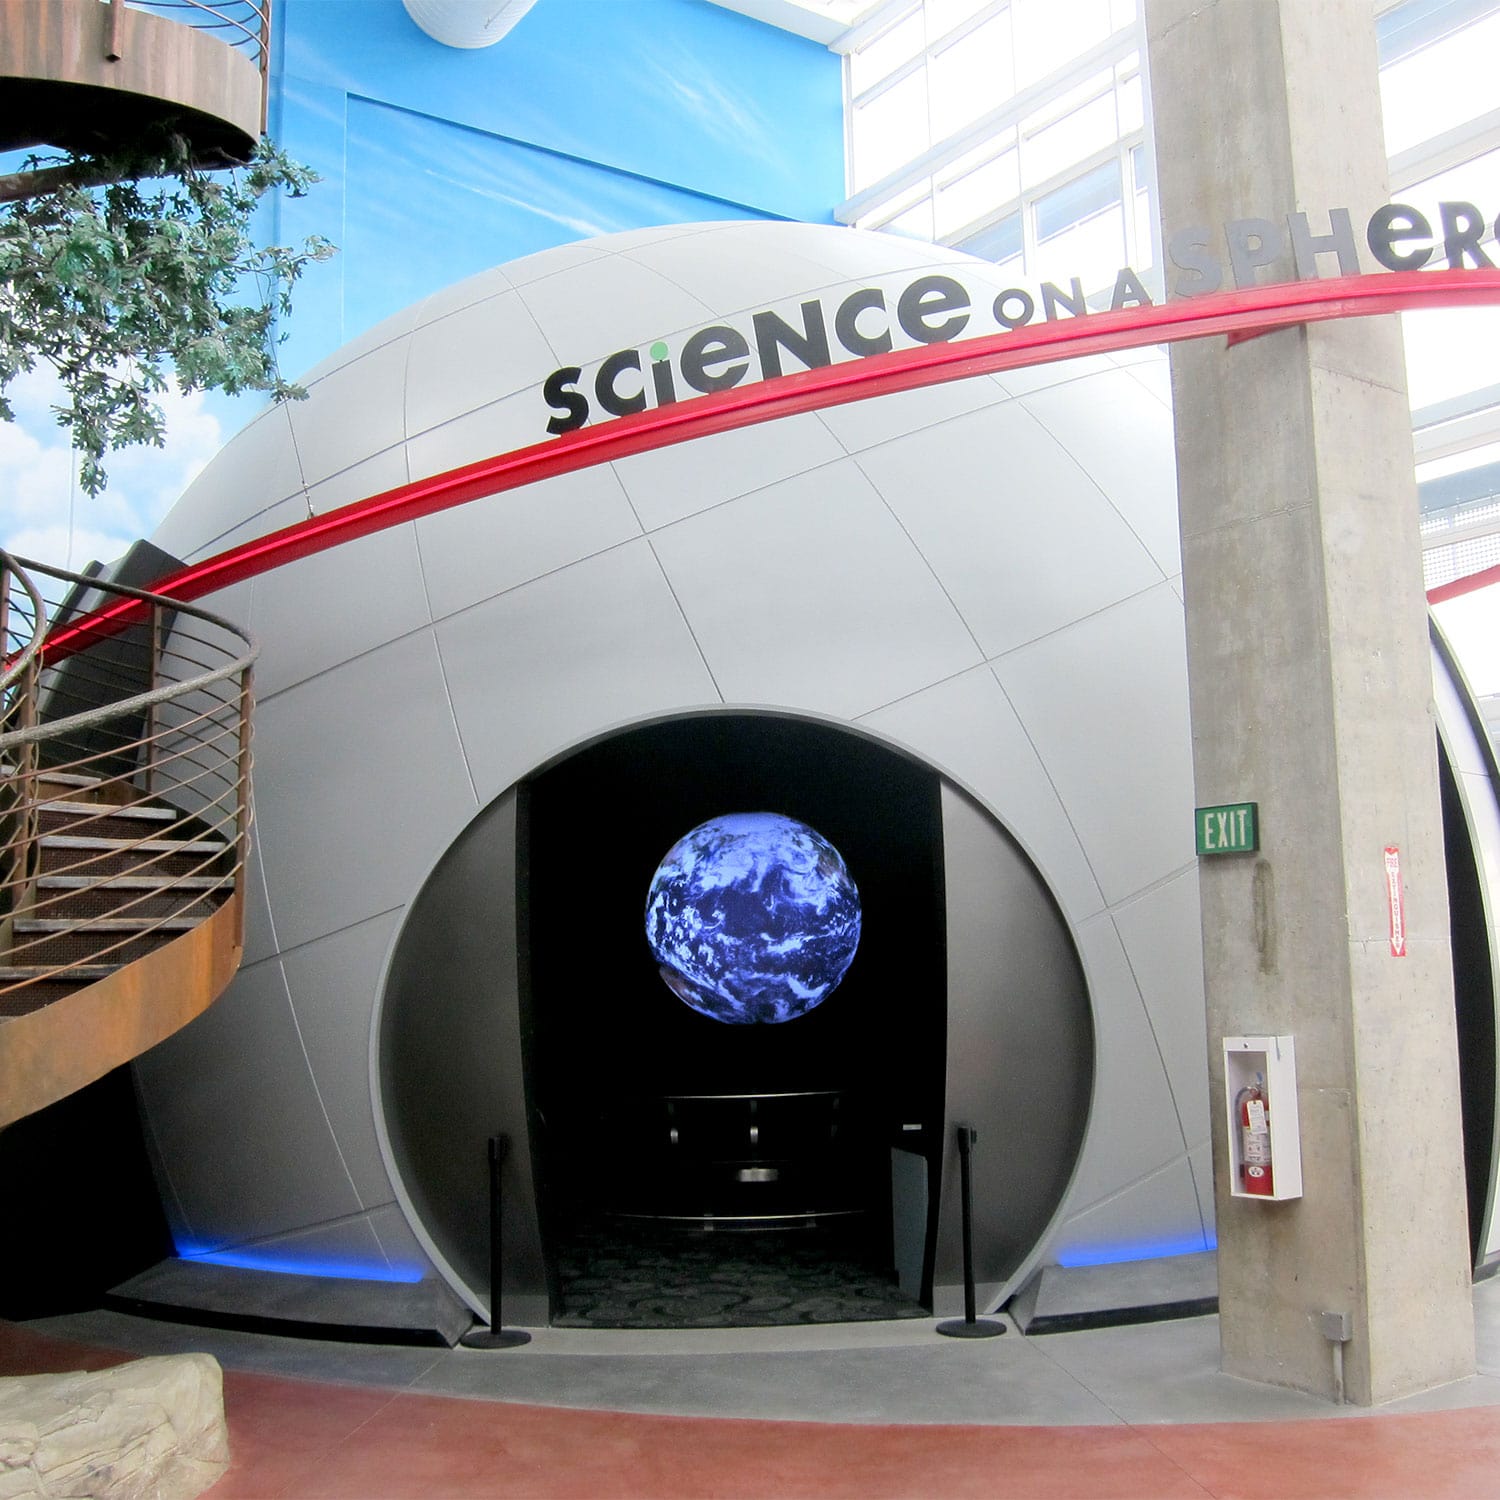
About Science On a Sphere®
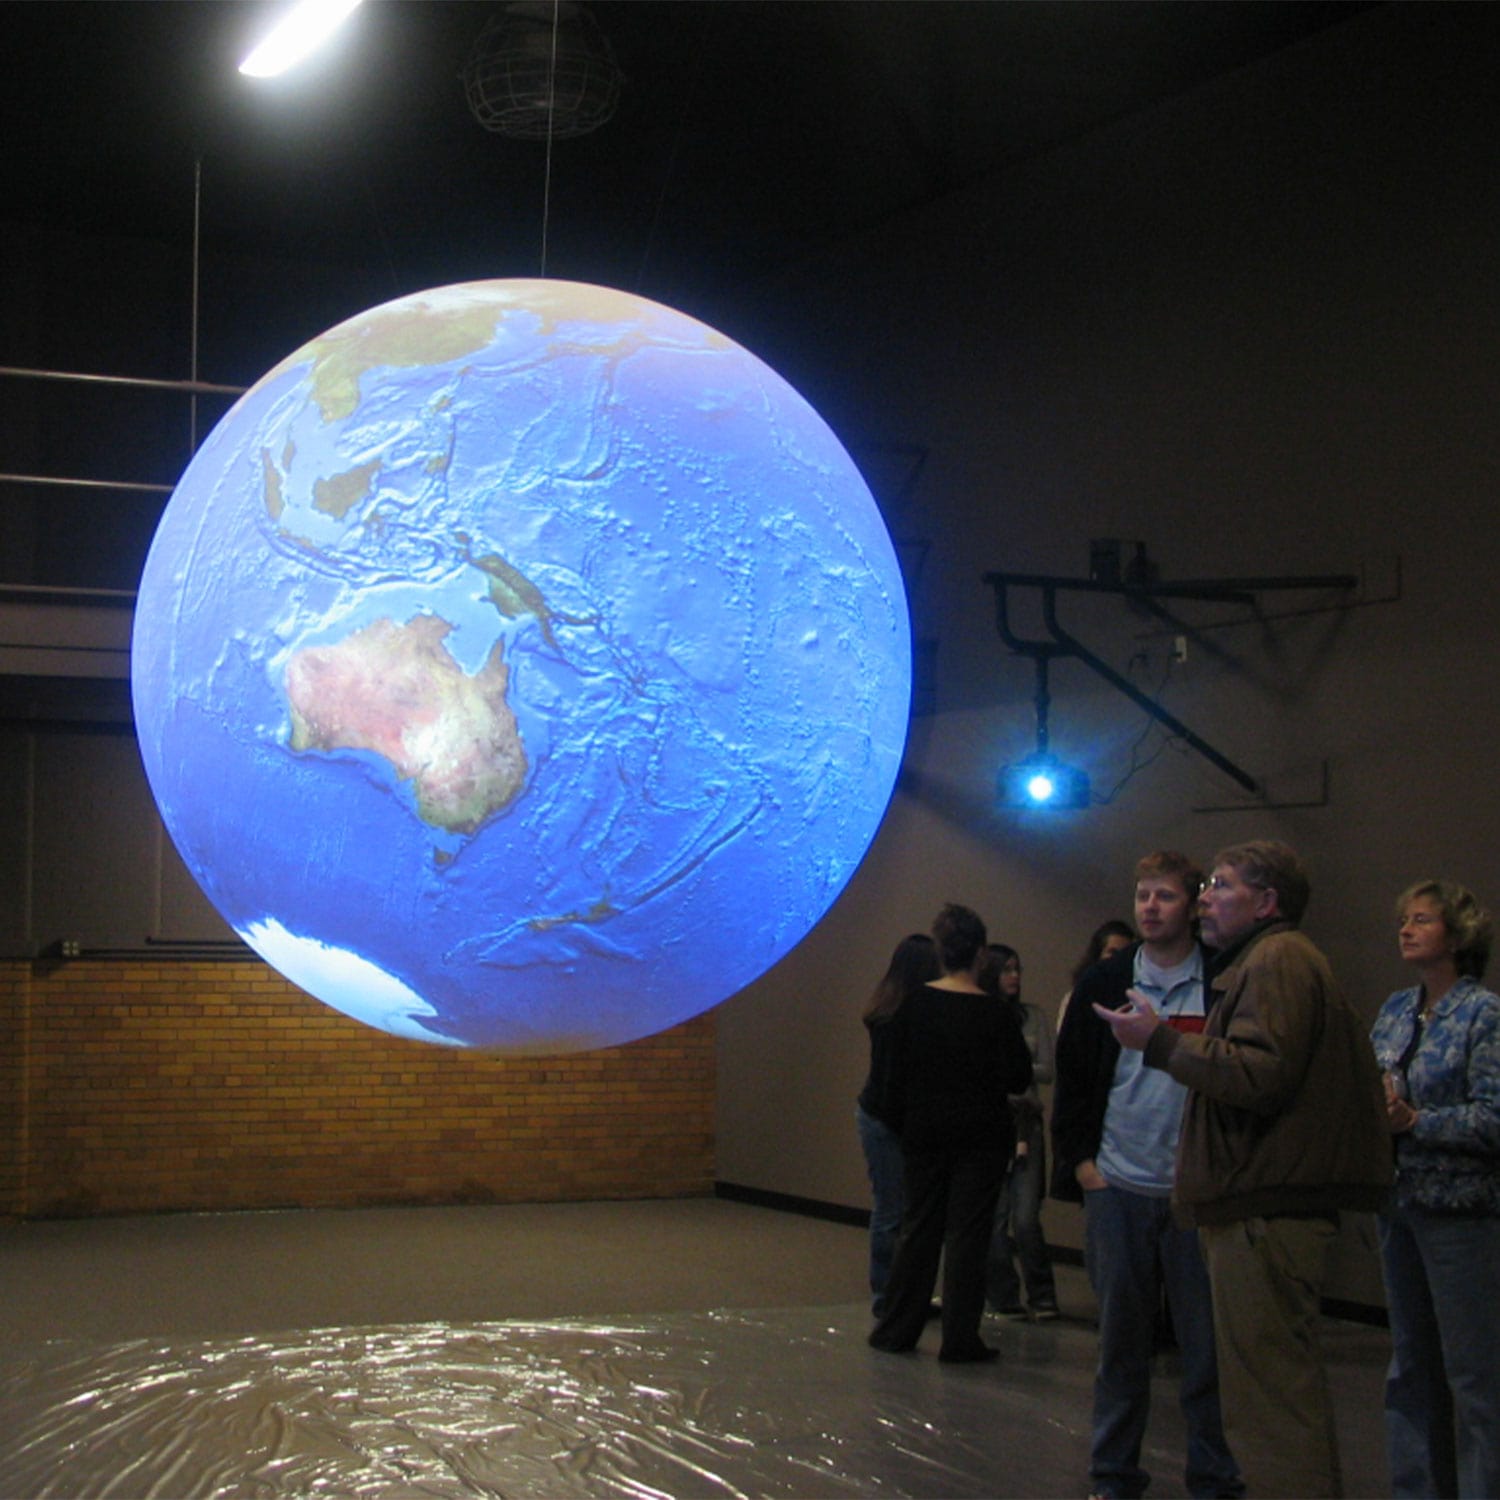
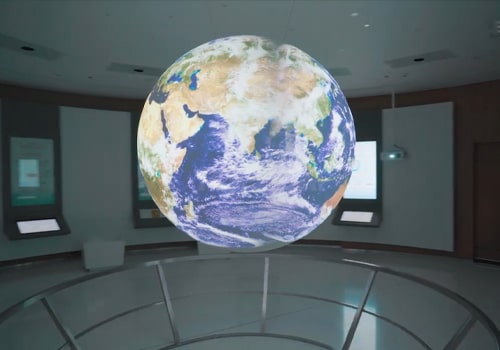
It is a room sized, global display system that uses custom software, computers, and video projectors to display planetary visualizations (and much more!) onto a large sphere, analogous to a giant animated globe.
For a sample of Science On a Sphere® in action, check out this presentation from the inventor
A Globe for the digital age
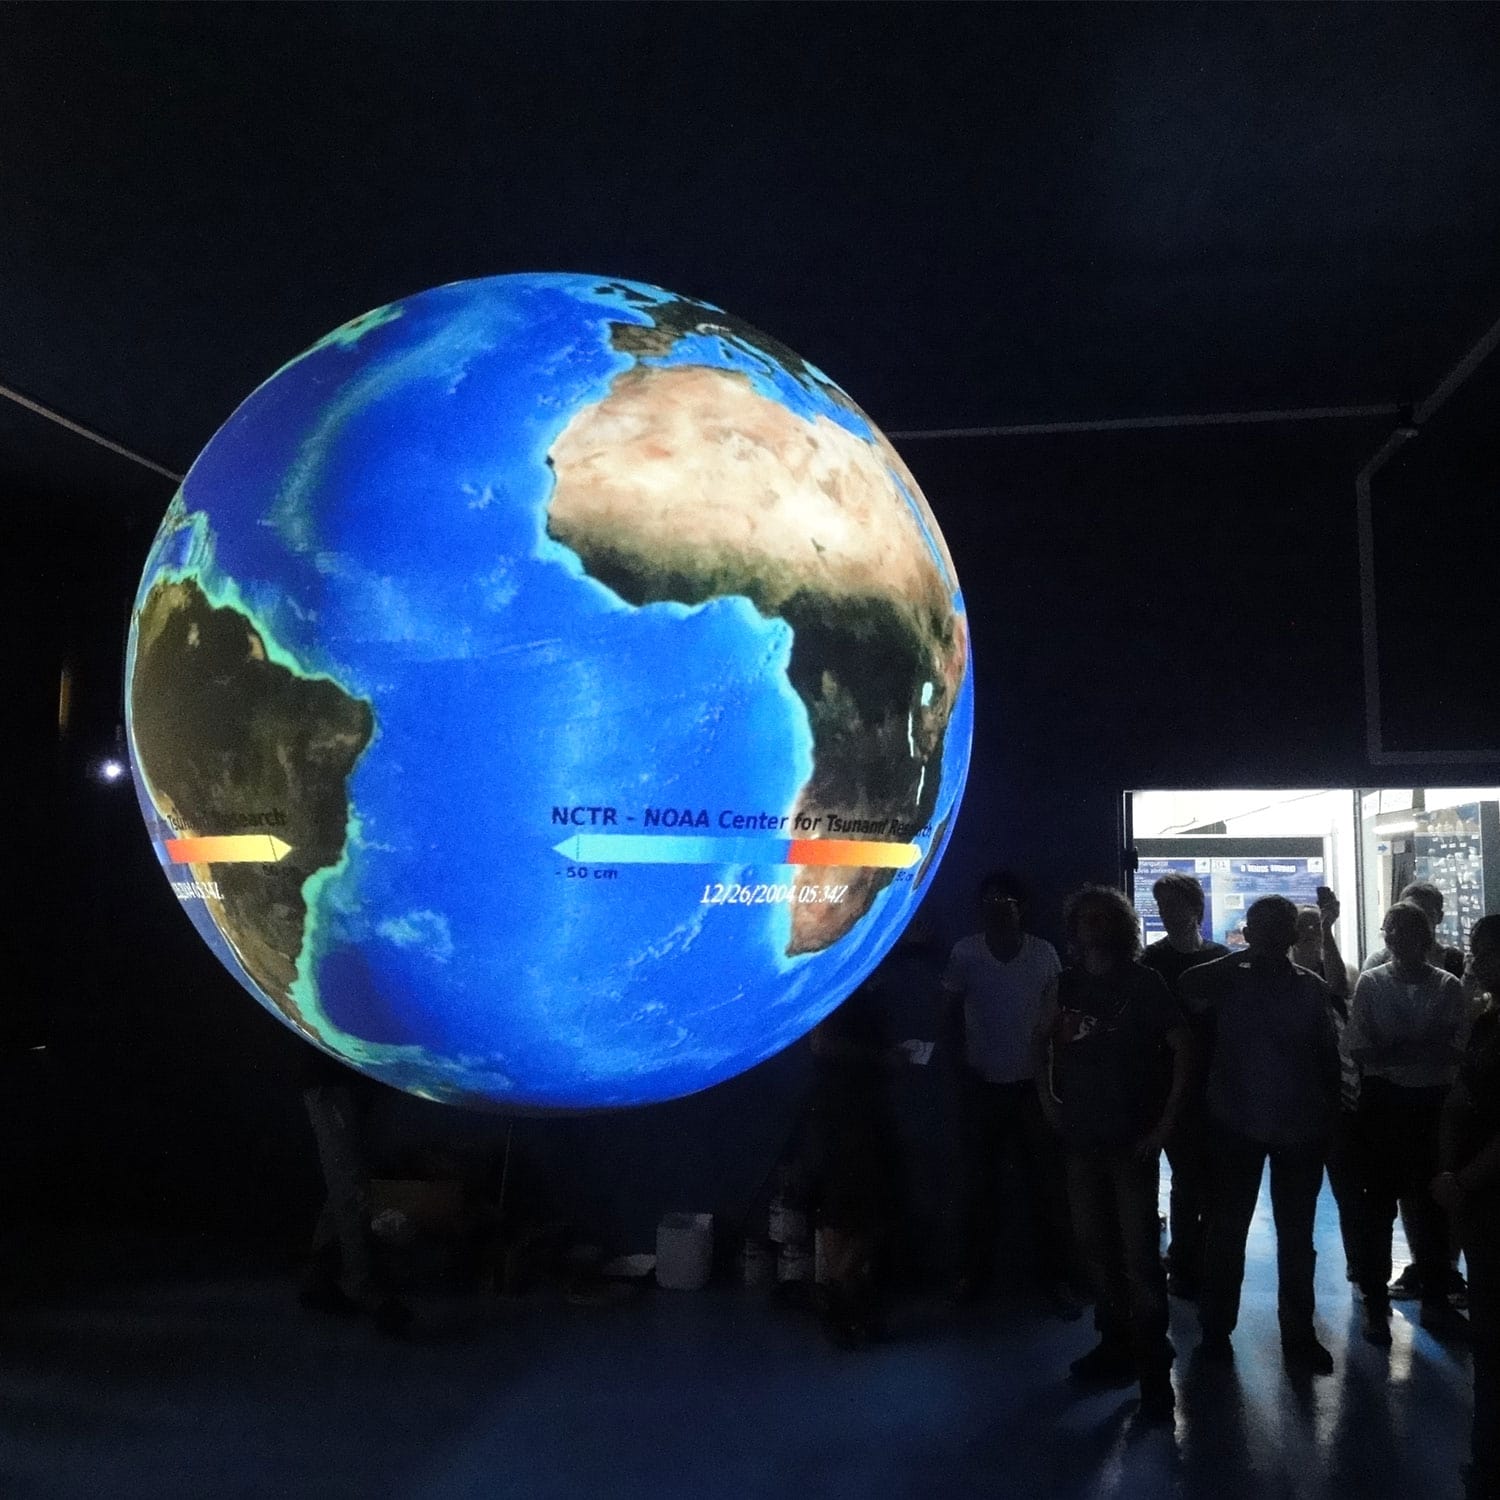
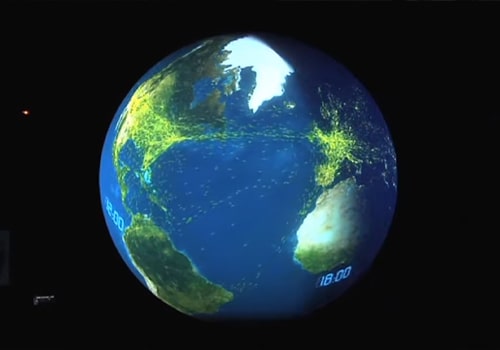
NOAA’s Science On a Sphere® uses computers and projectors to display visualizations of planetary data on a sphere, analogous to a giant, animated globe.
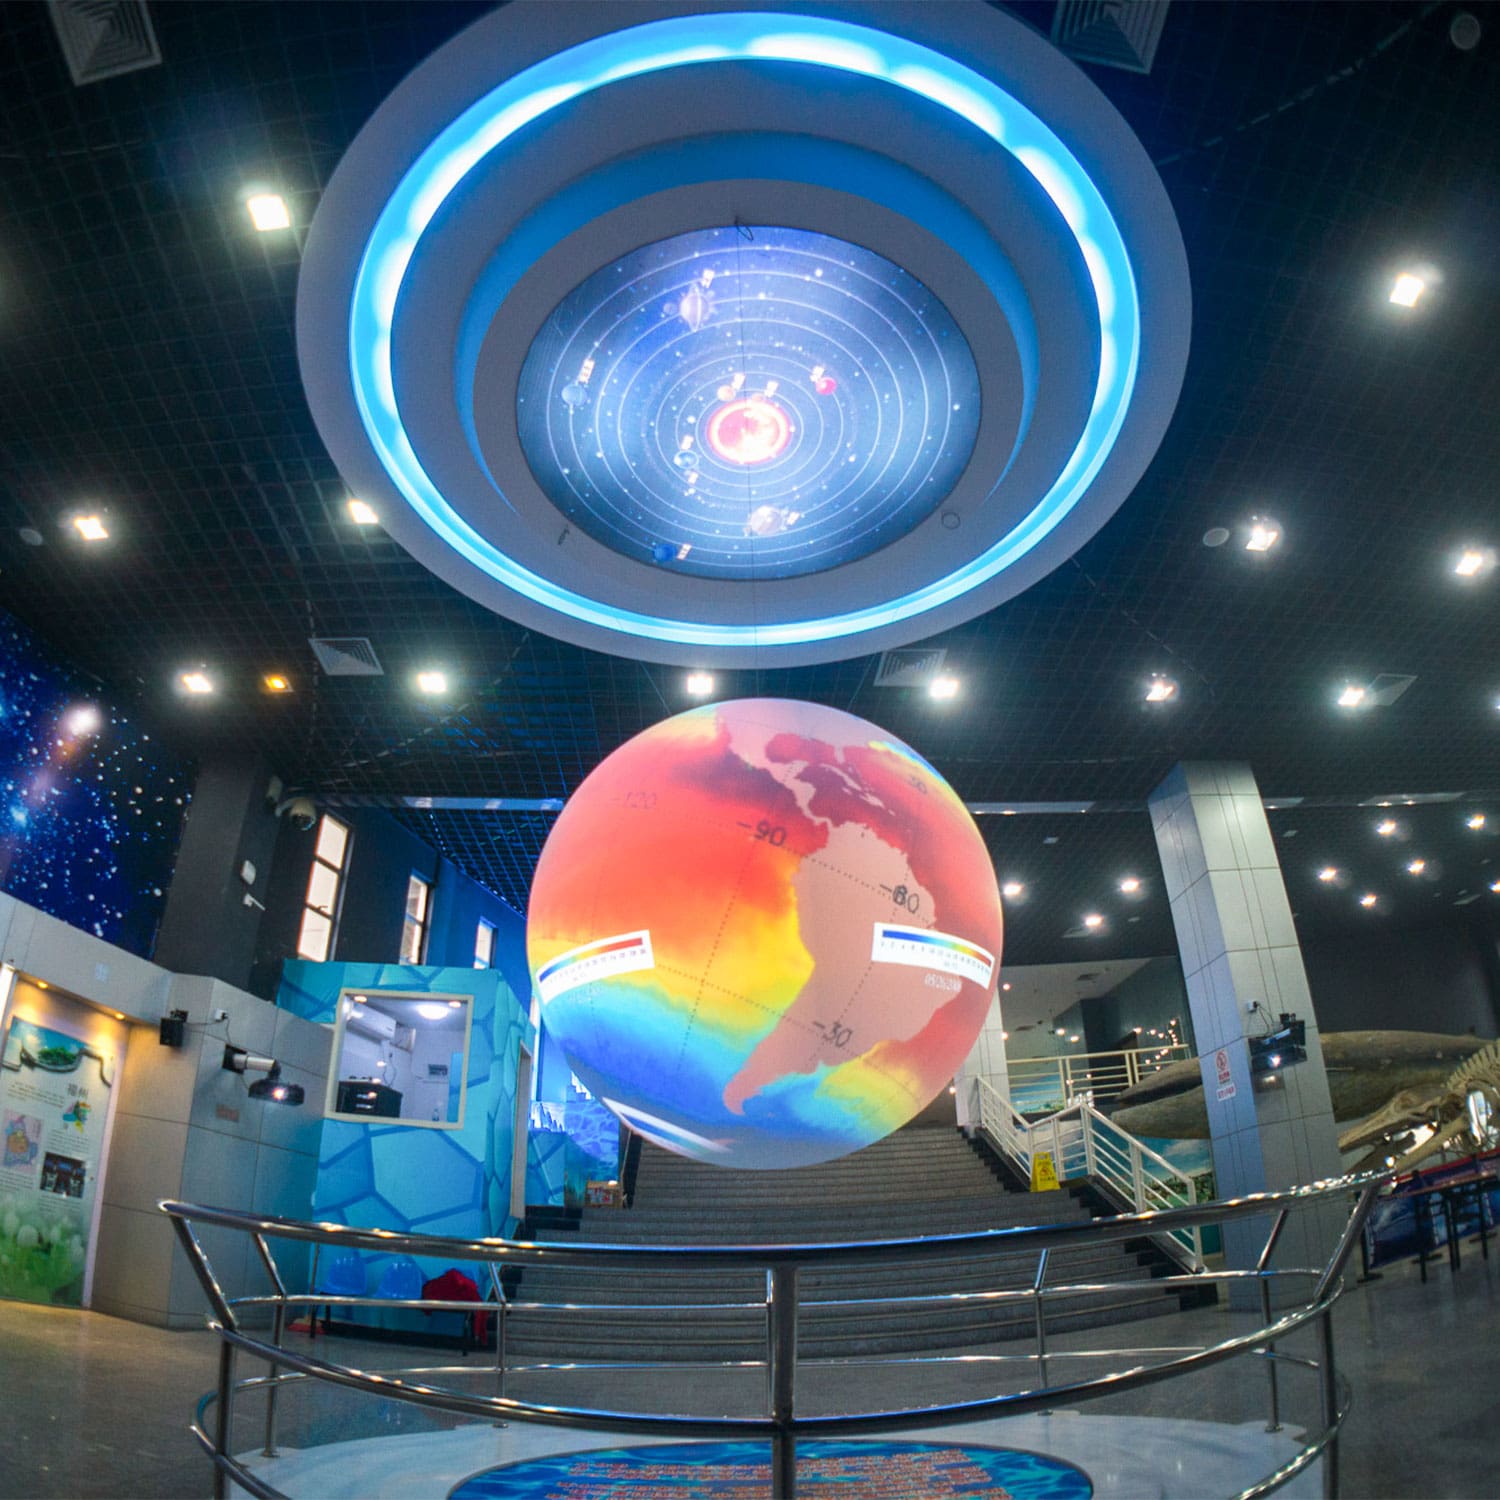
Over 600 datasets
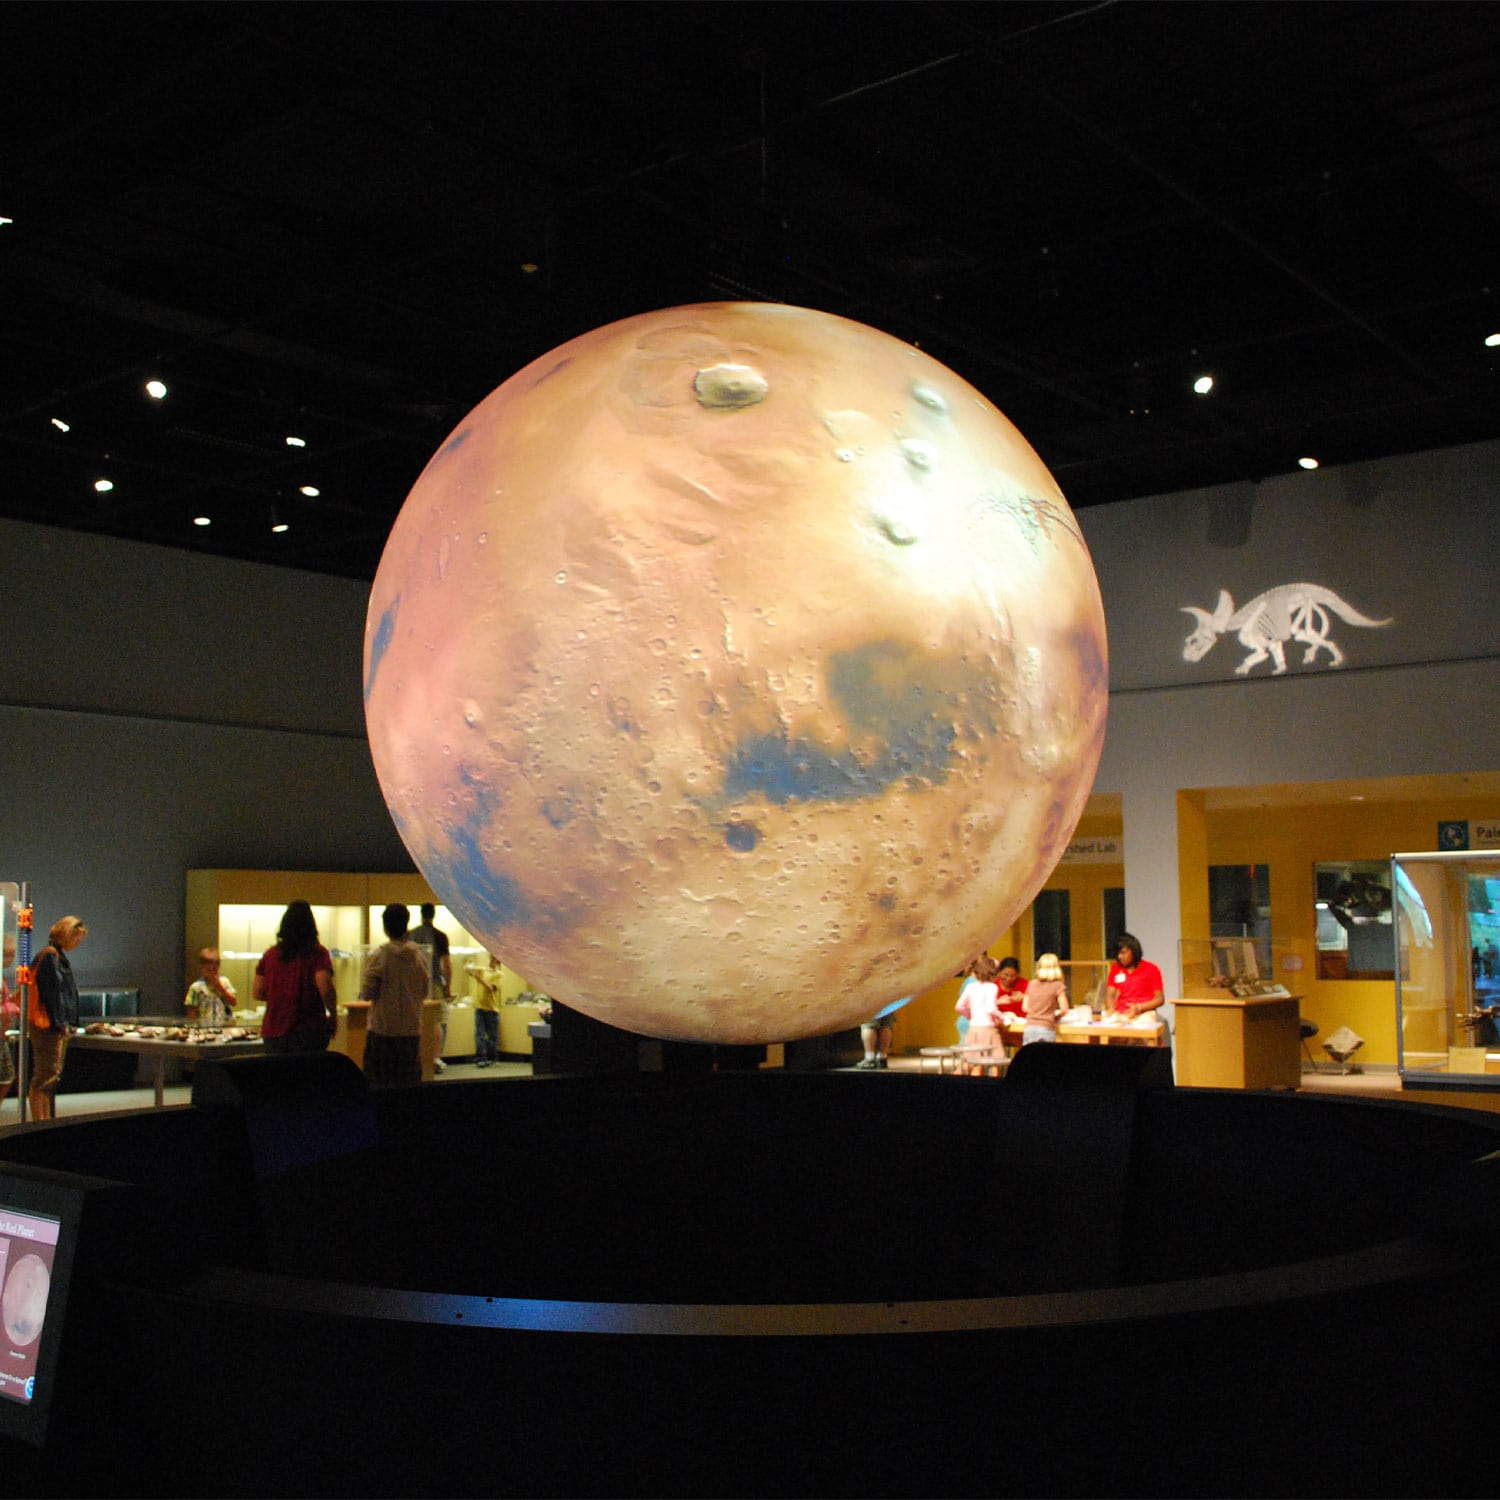
There are over 600 datasets available for SOS and SOSx ranging from ocean currents to ultraviolet visualizations of our sun.
175+ locations
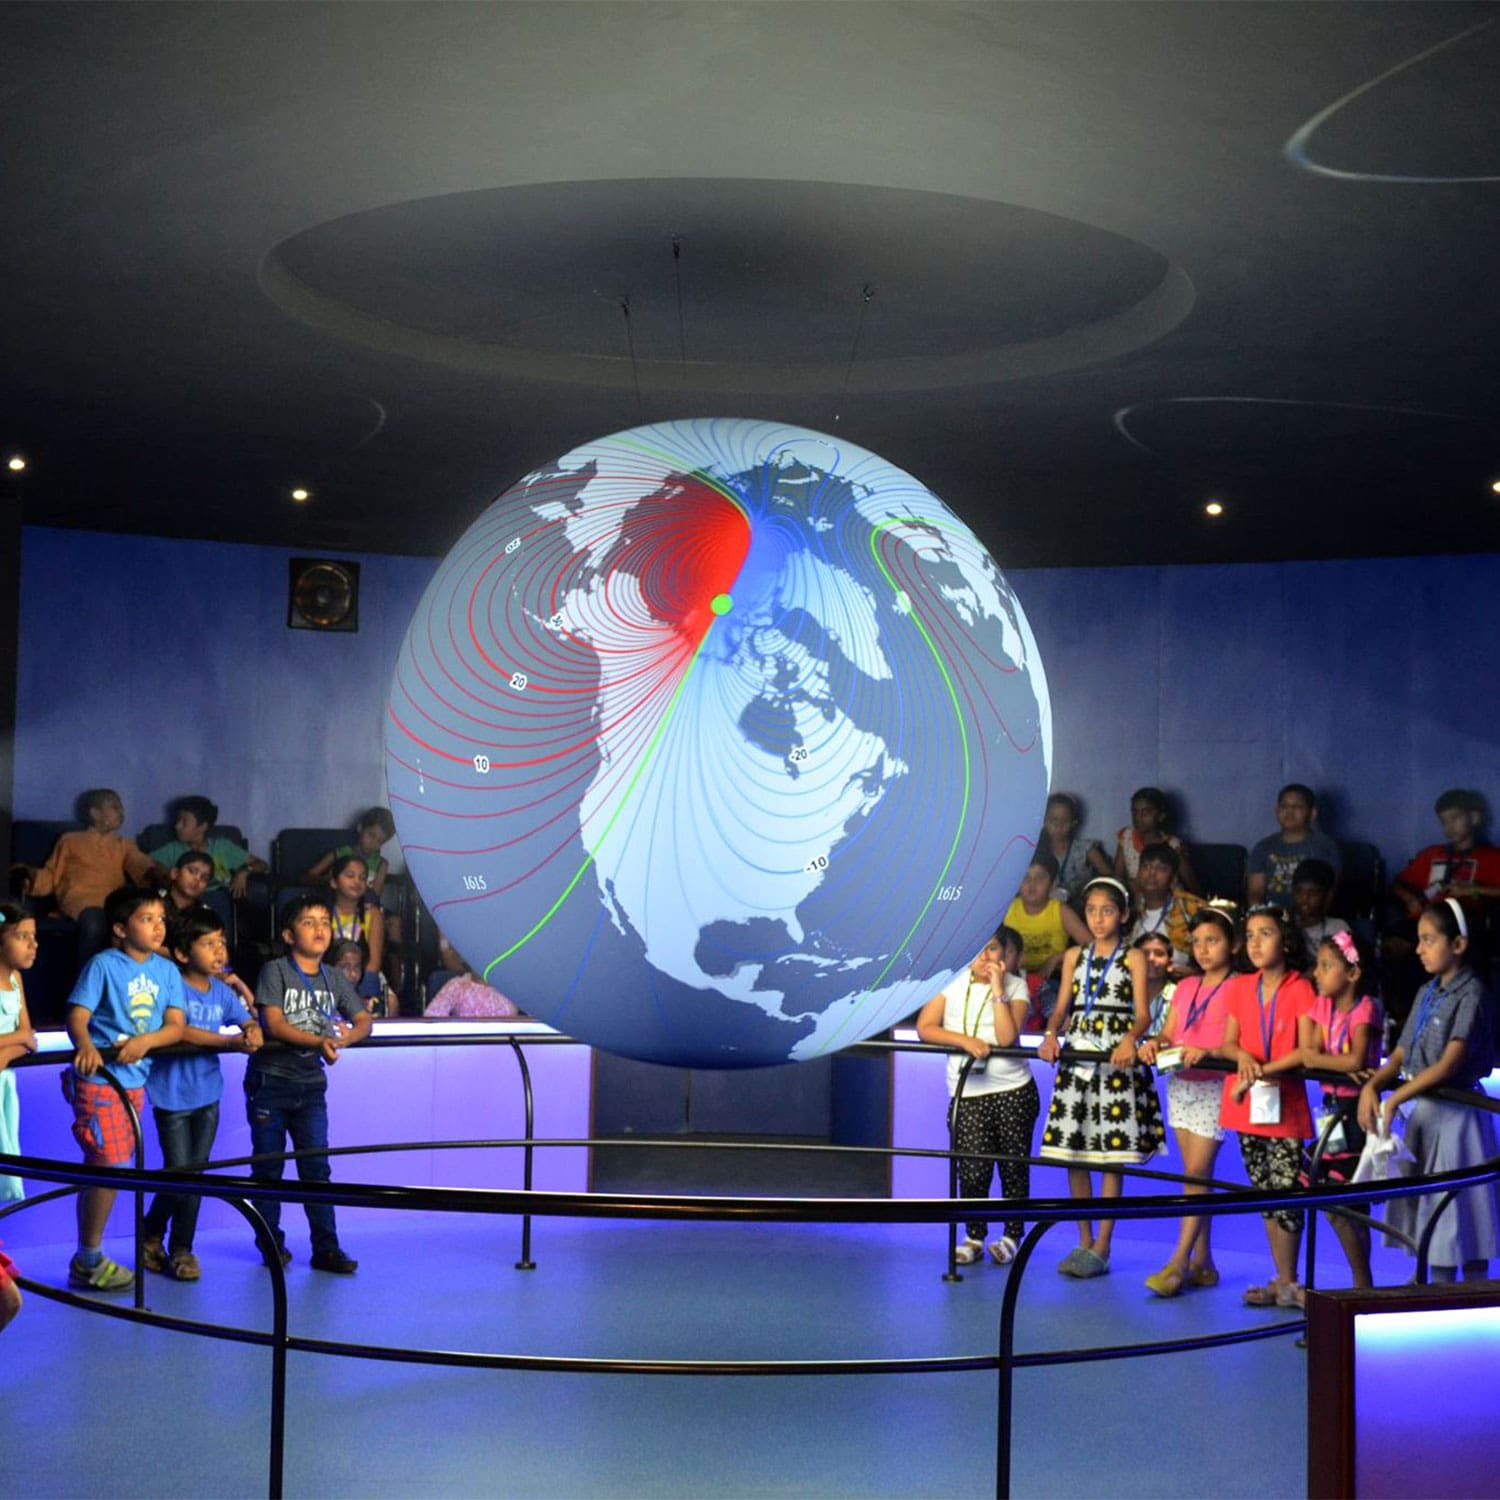
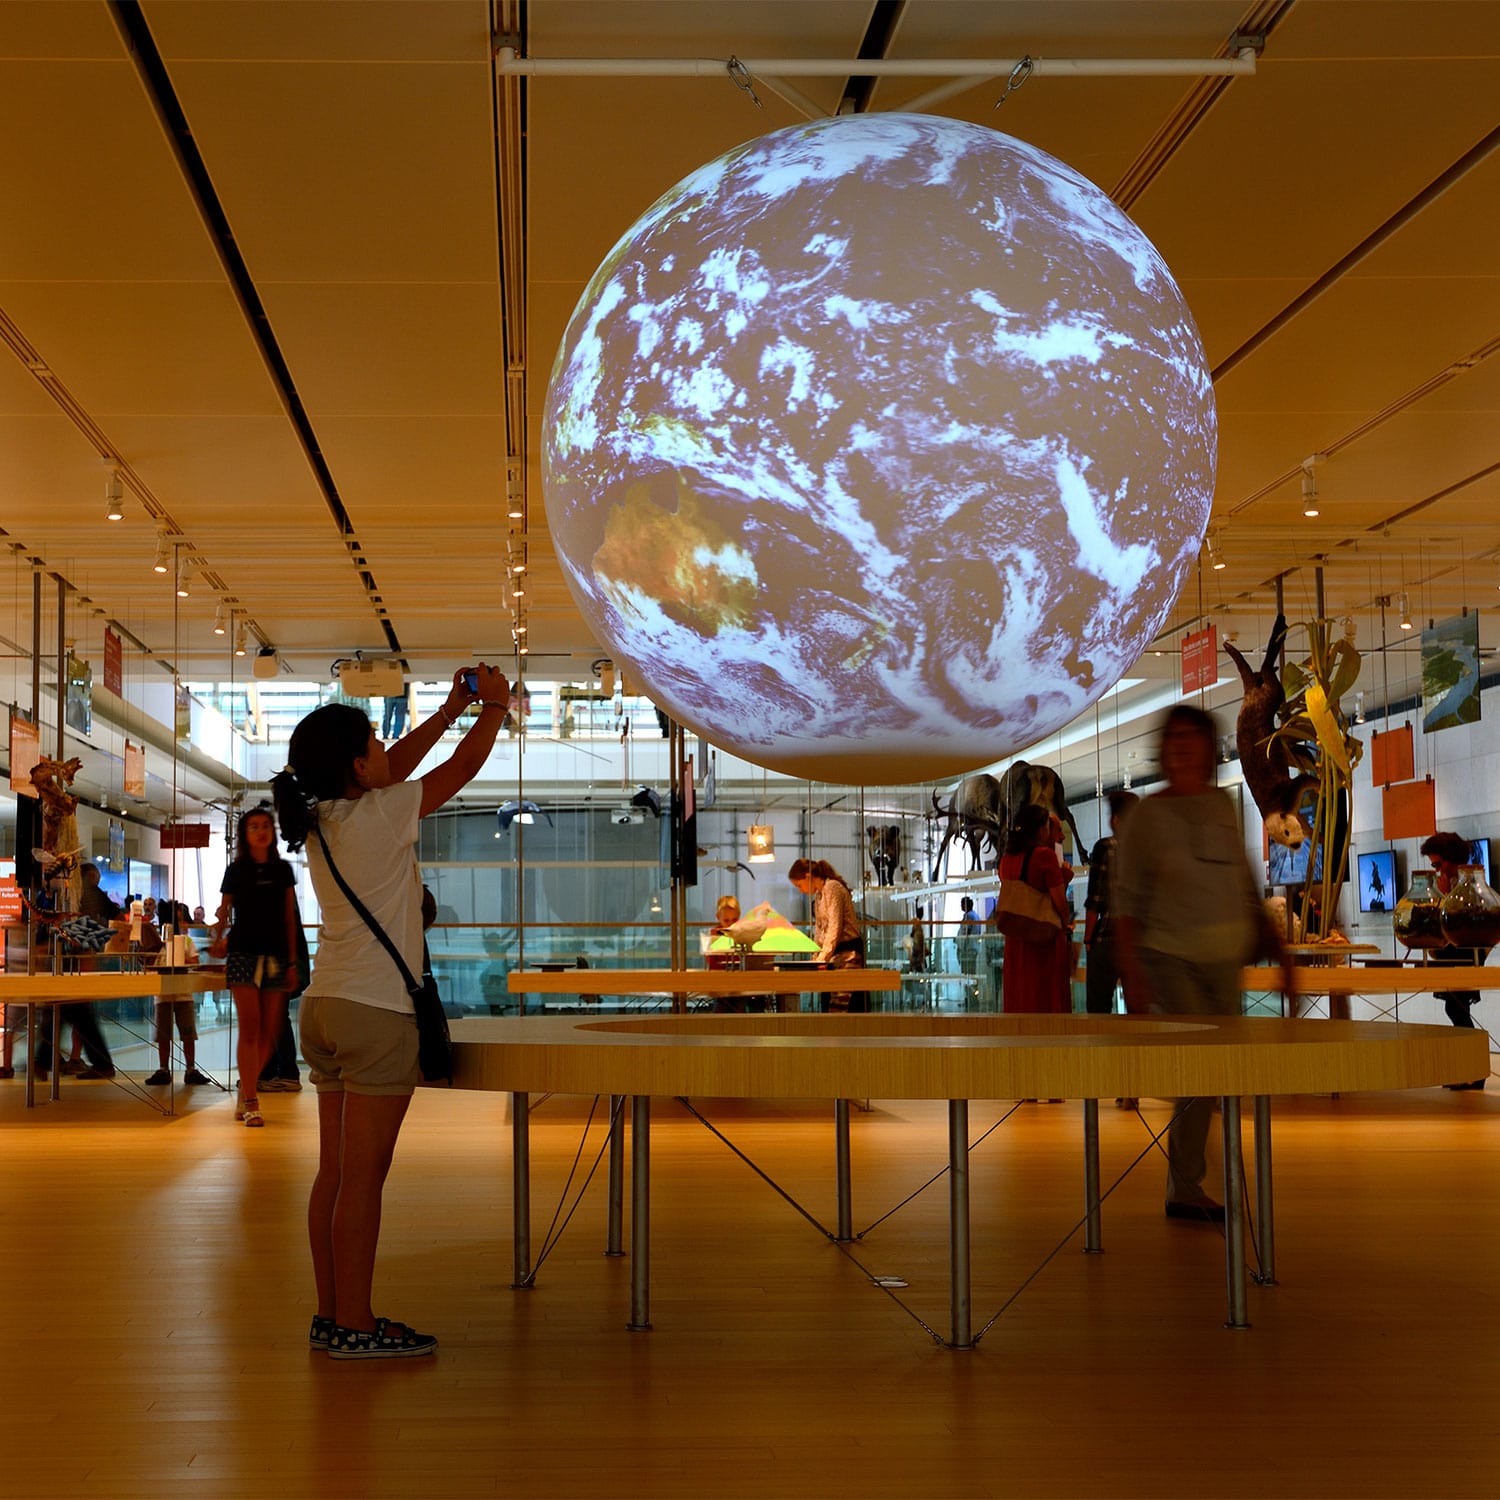
NOAA’s Science On a Sphere and SOS Explorer® are installed at over 175 sites worldwide.
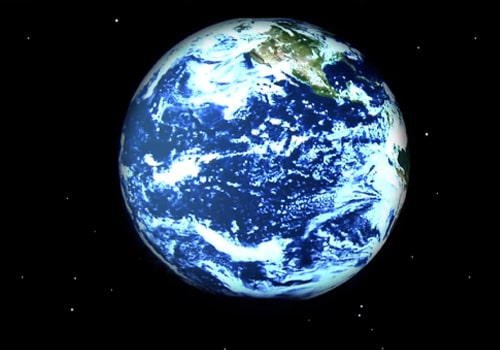
What is SOS?
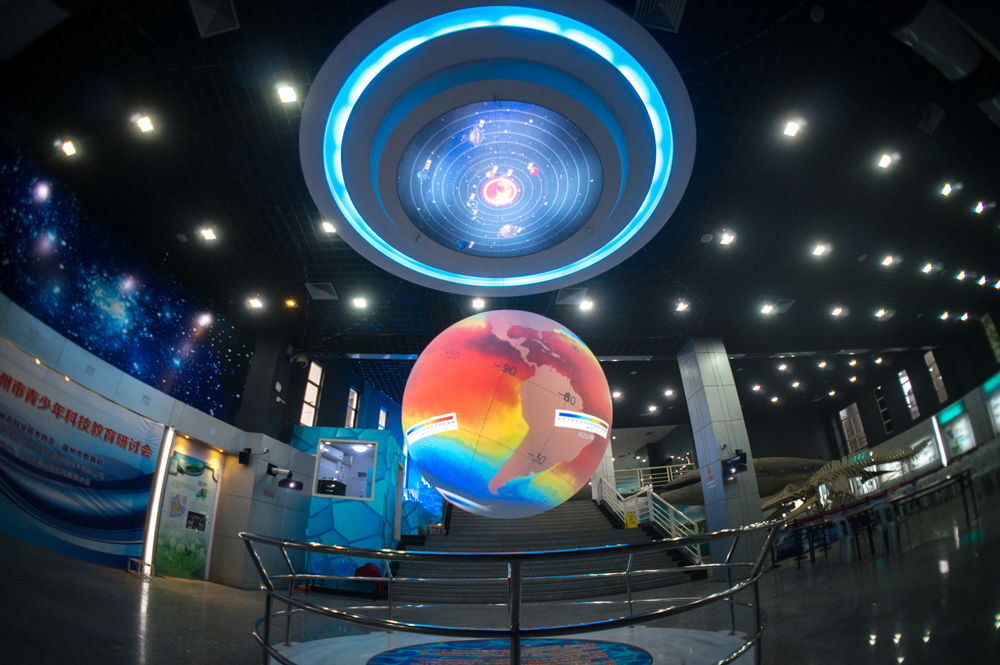
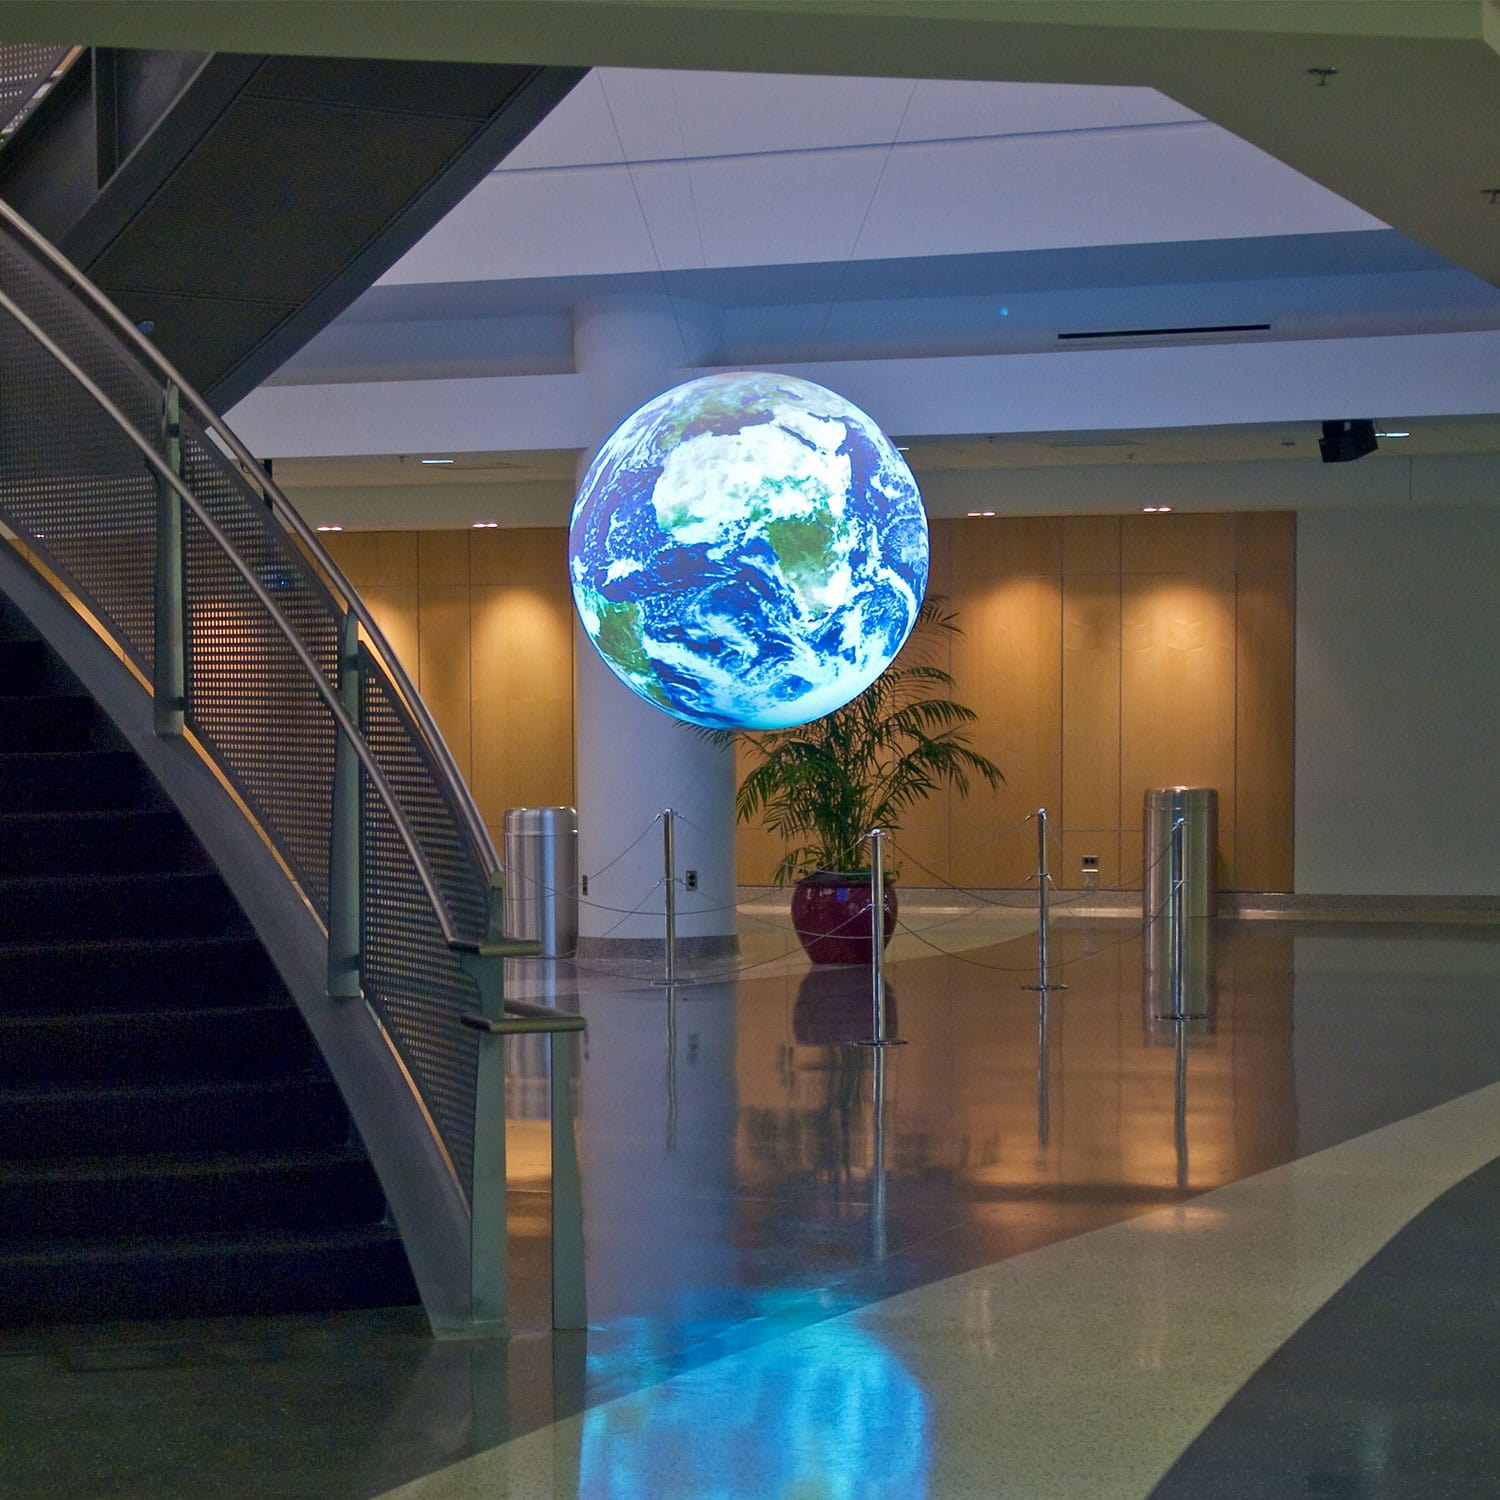
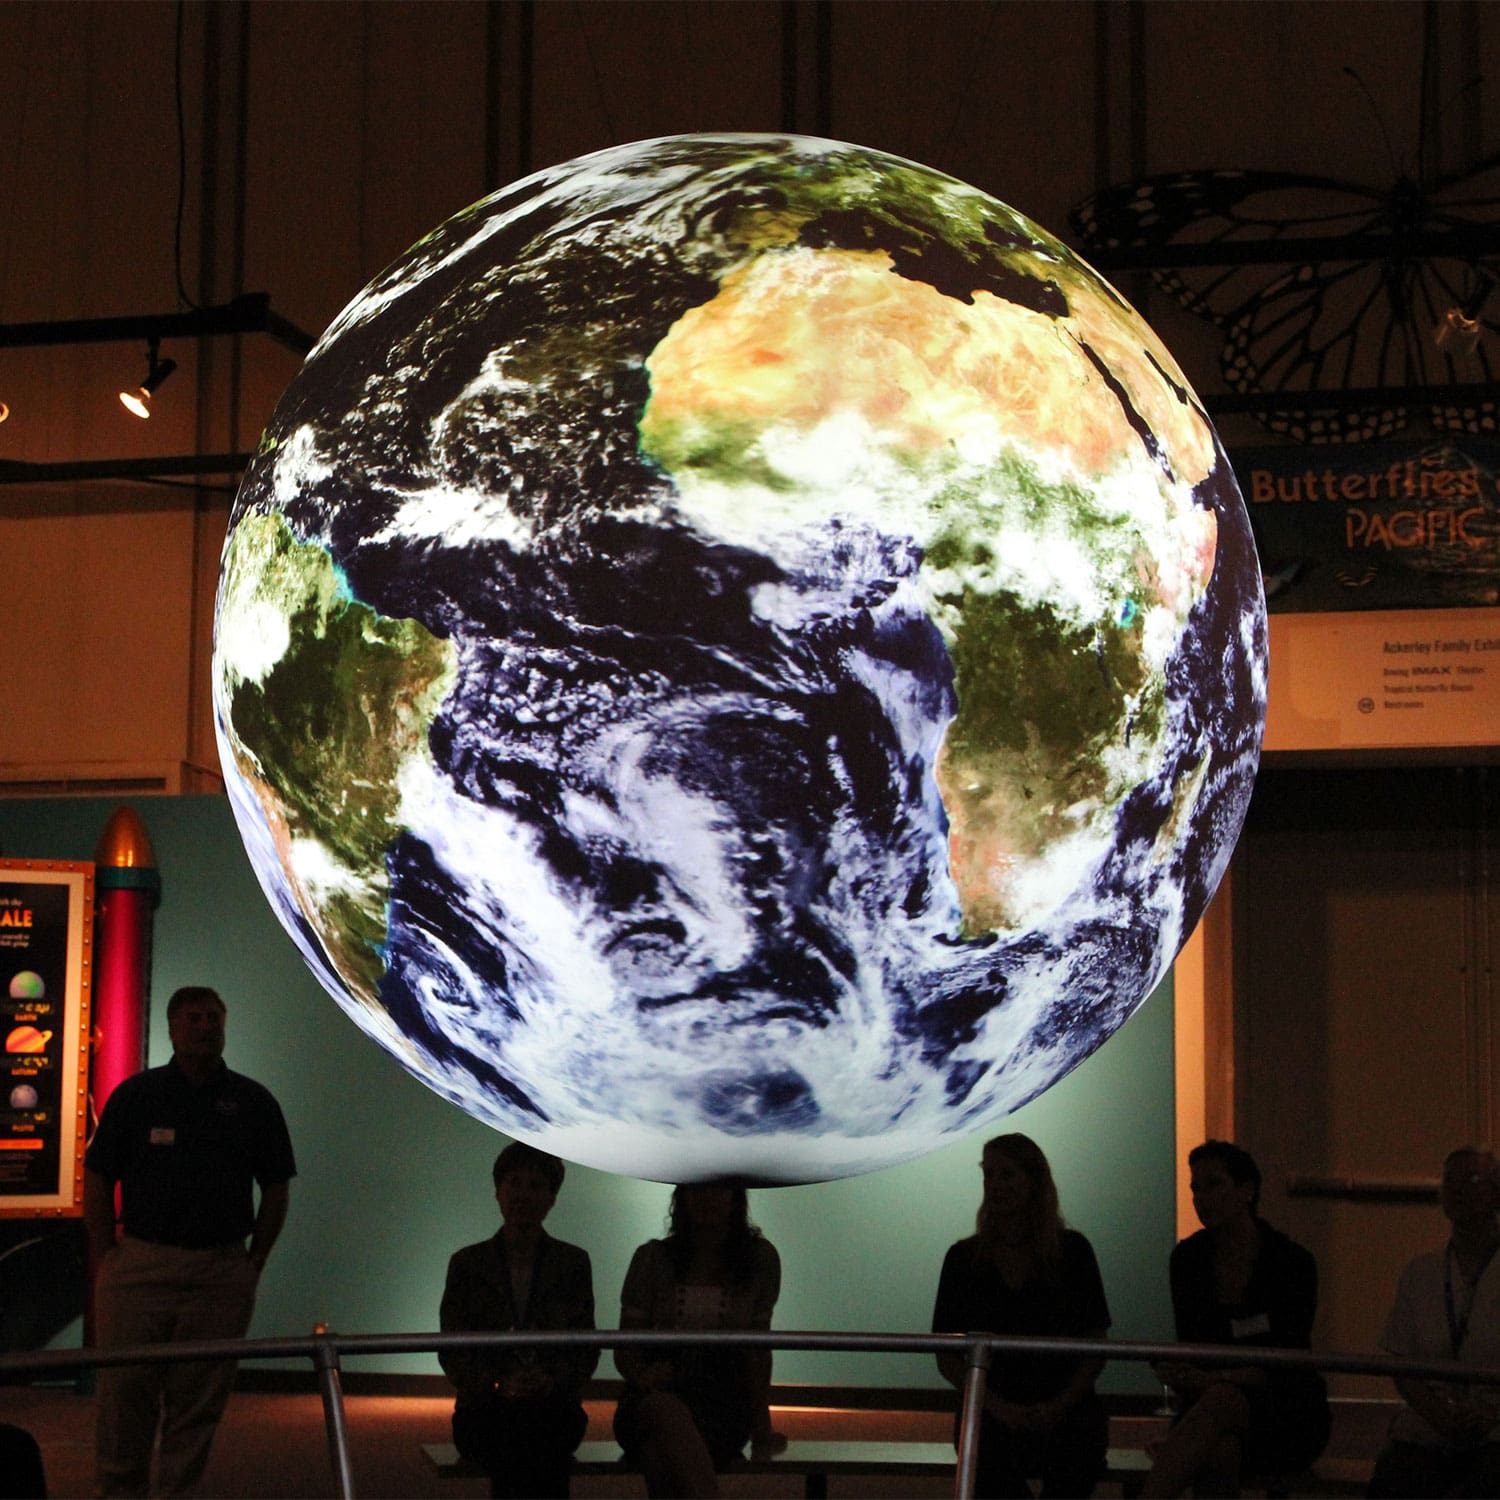
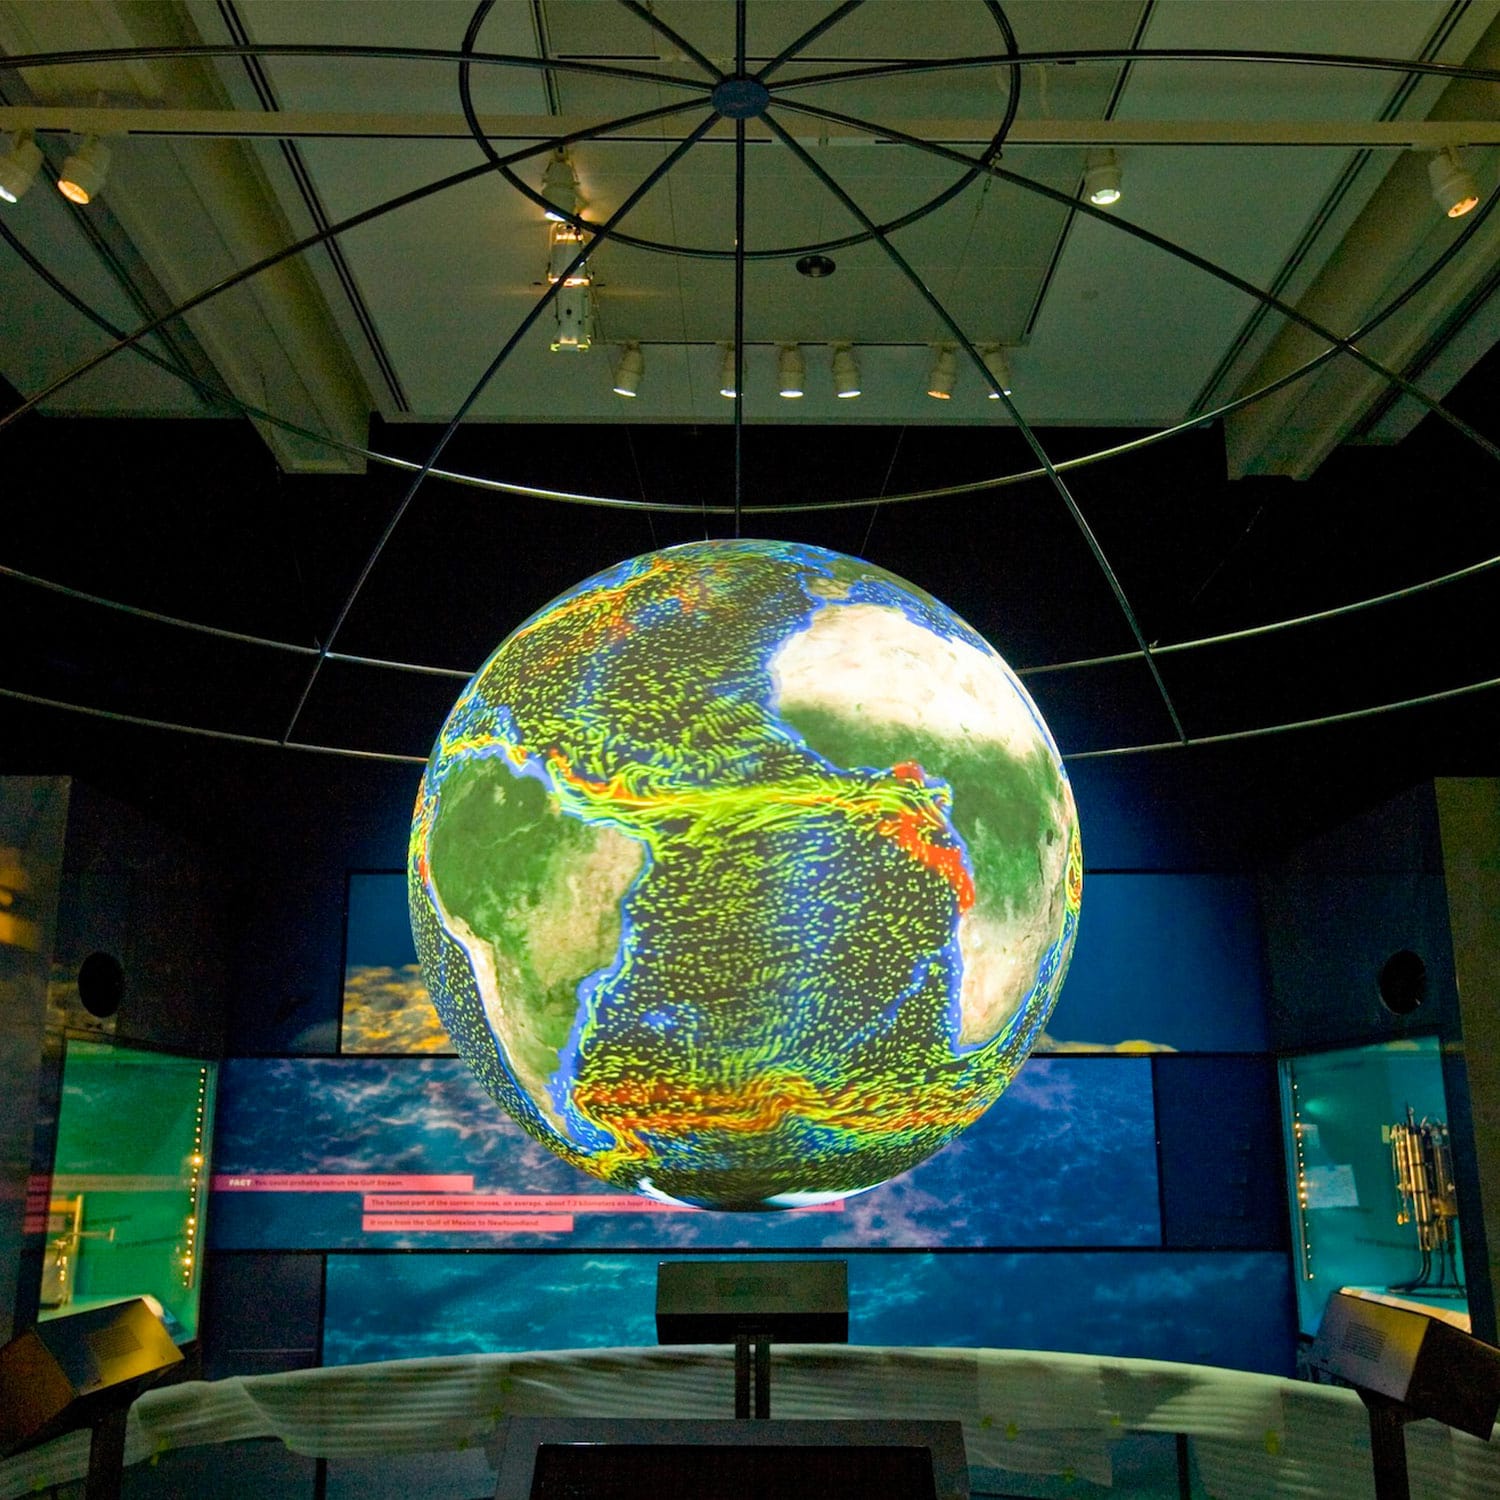
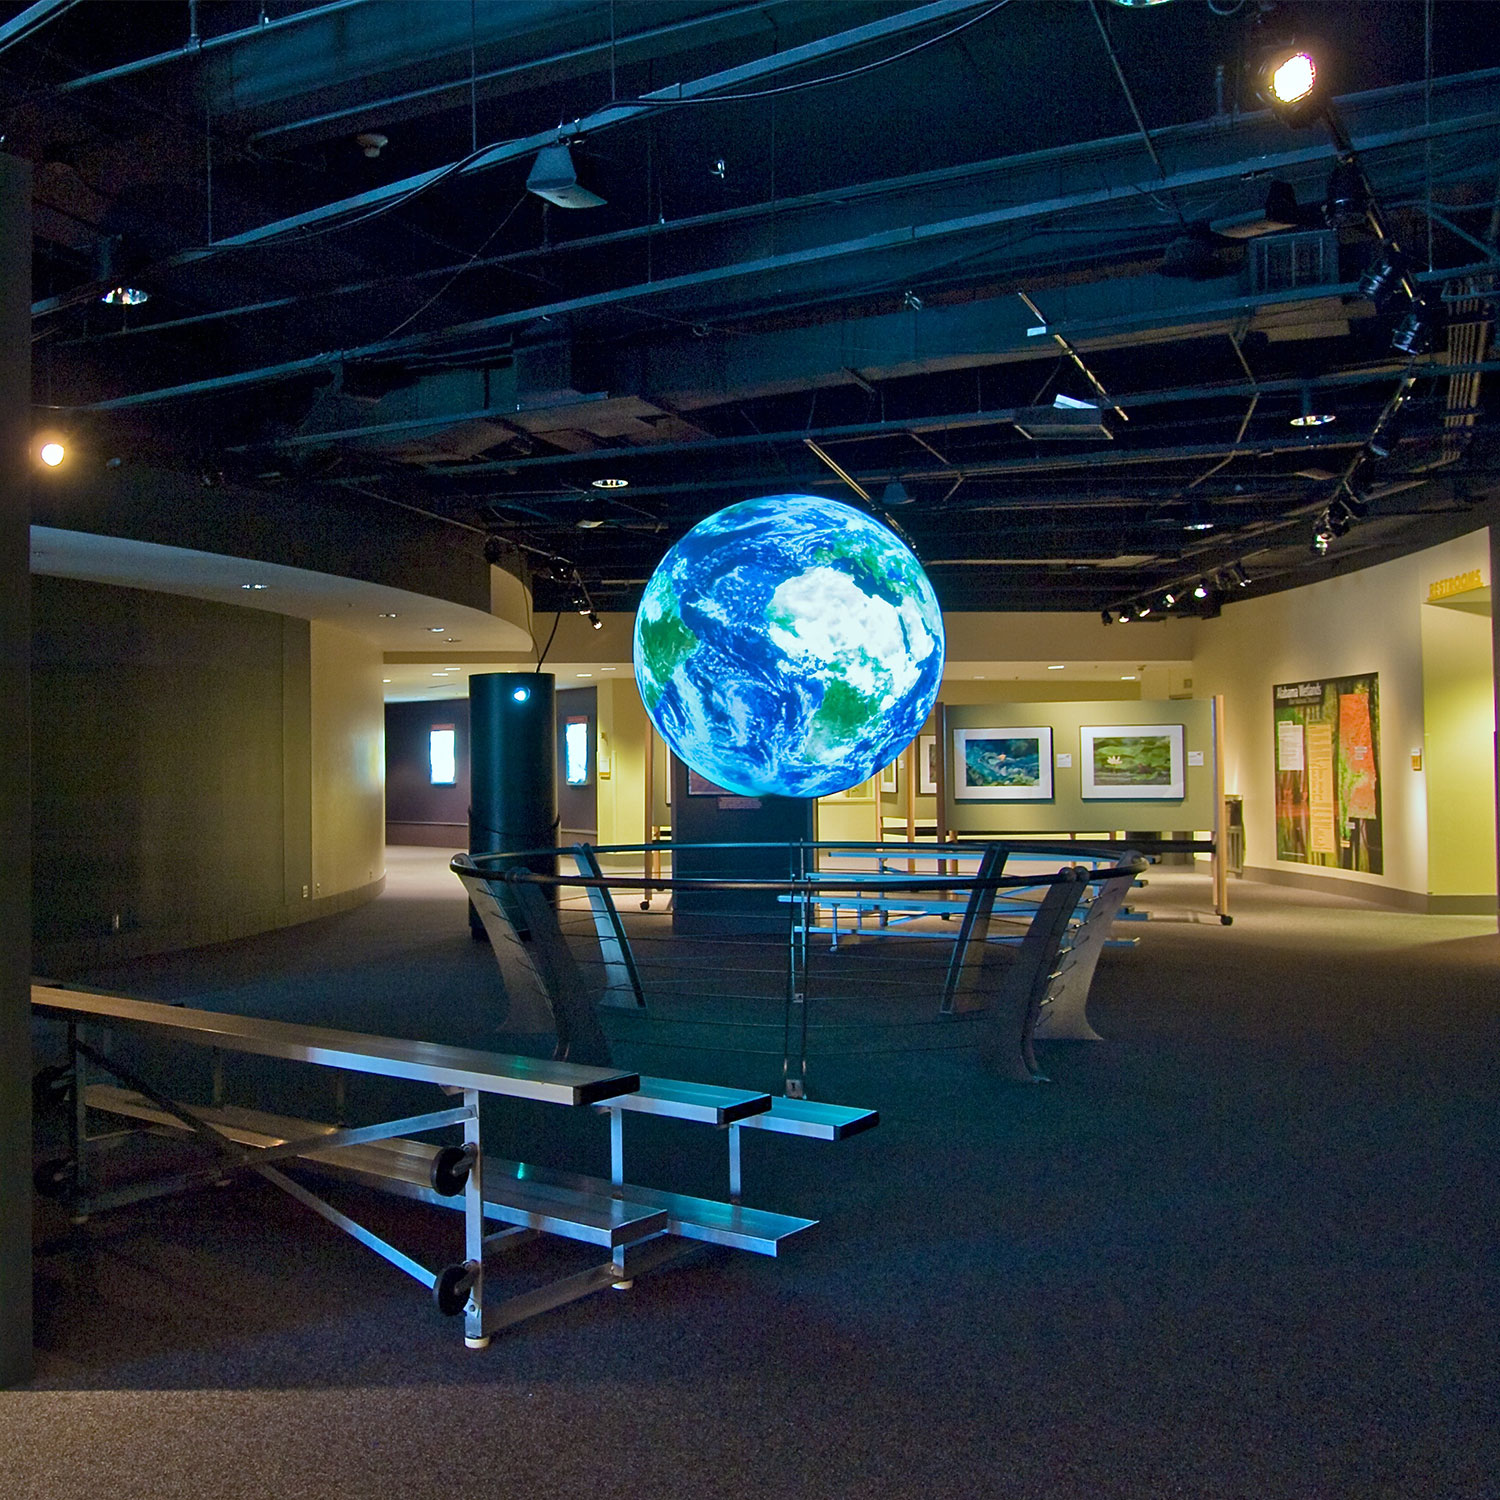
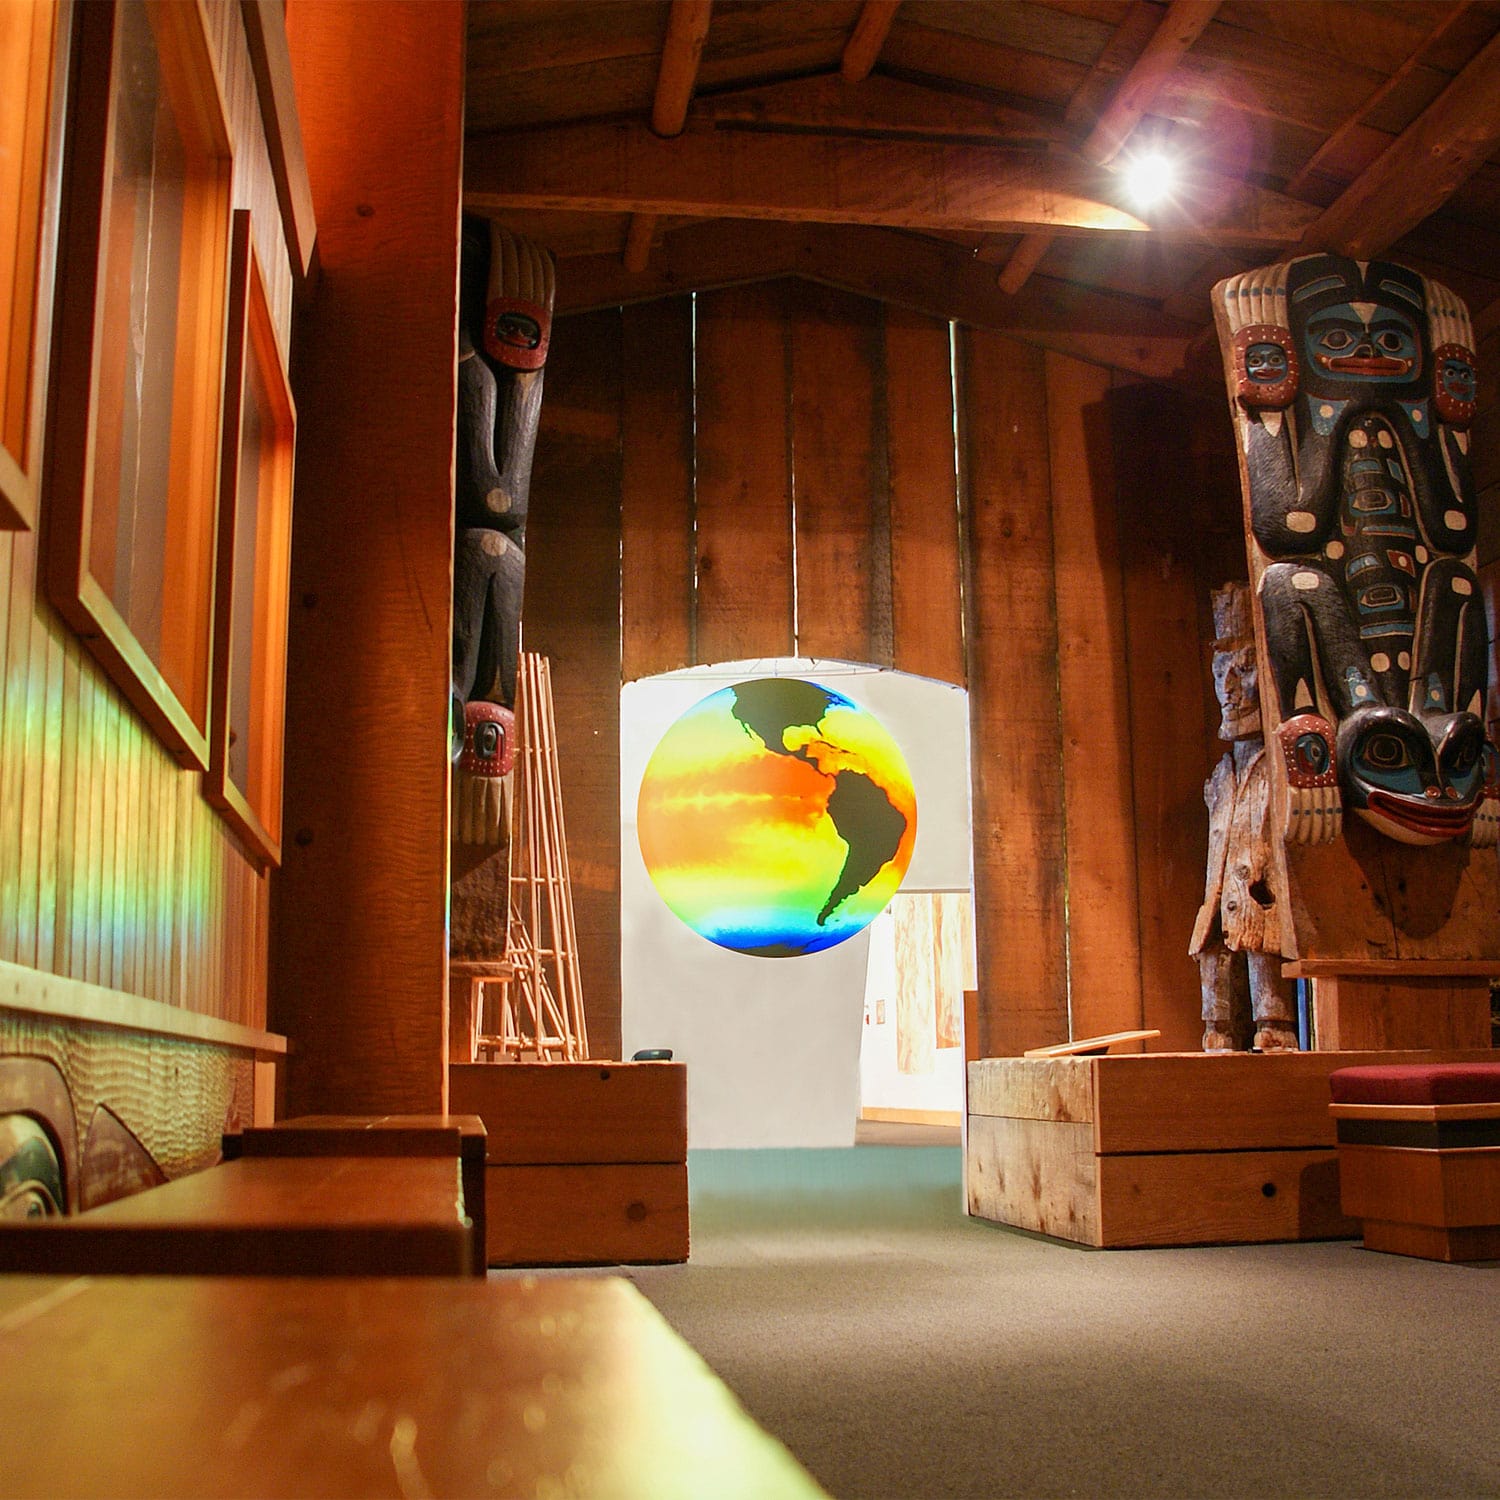
NOAA's Science On a Sphere® (SOS) is a room sized, global display system that uses computers and video projectors to display planetary data onto a six foot diameter sphere, analogous to a giant animated globe.
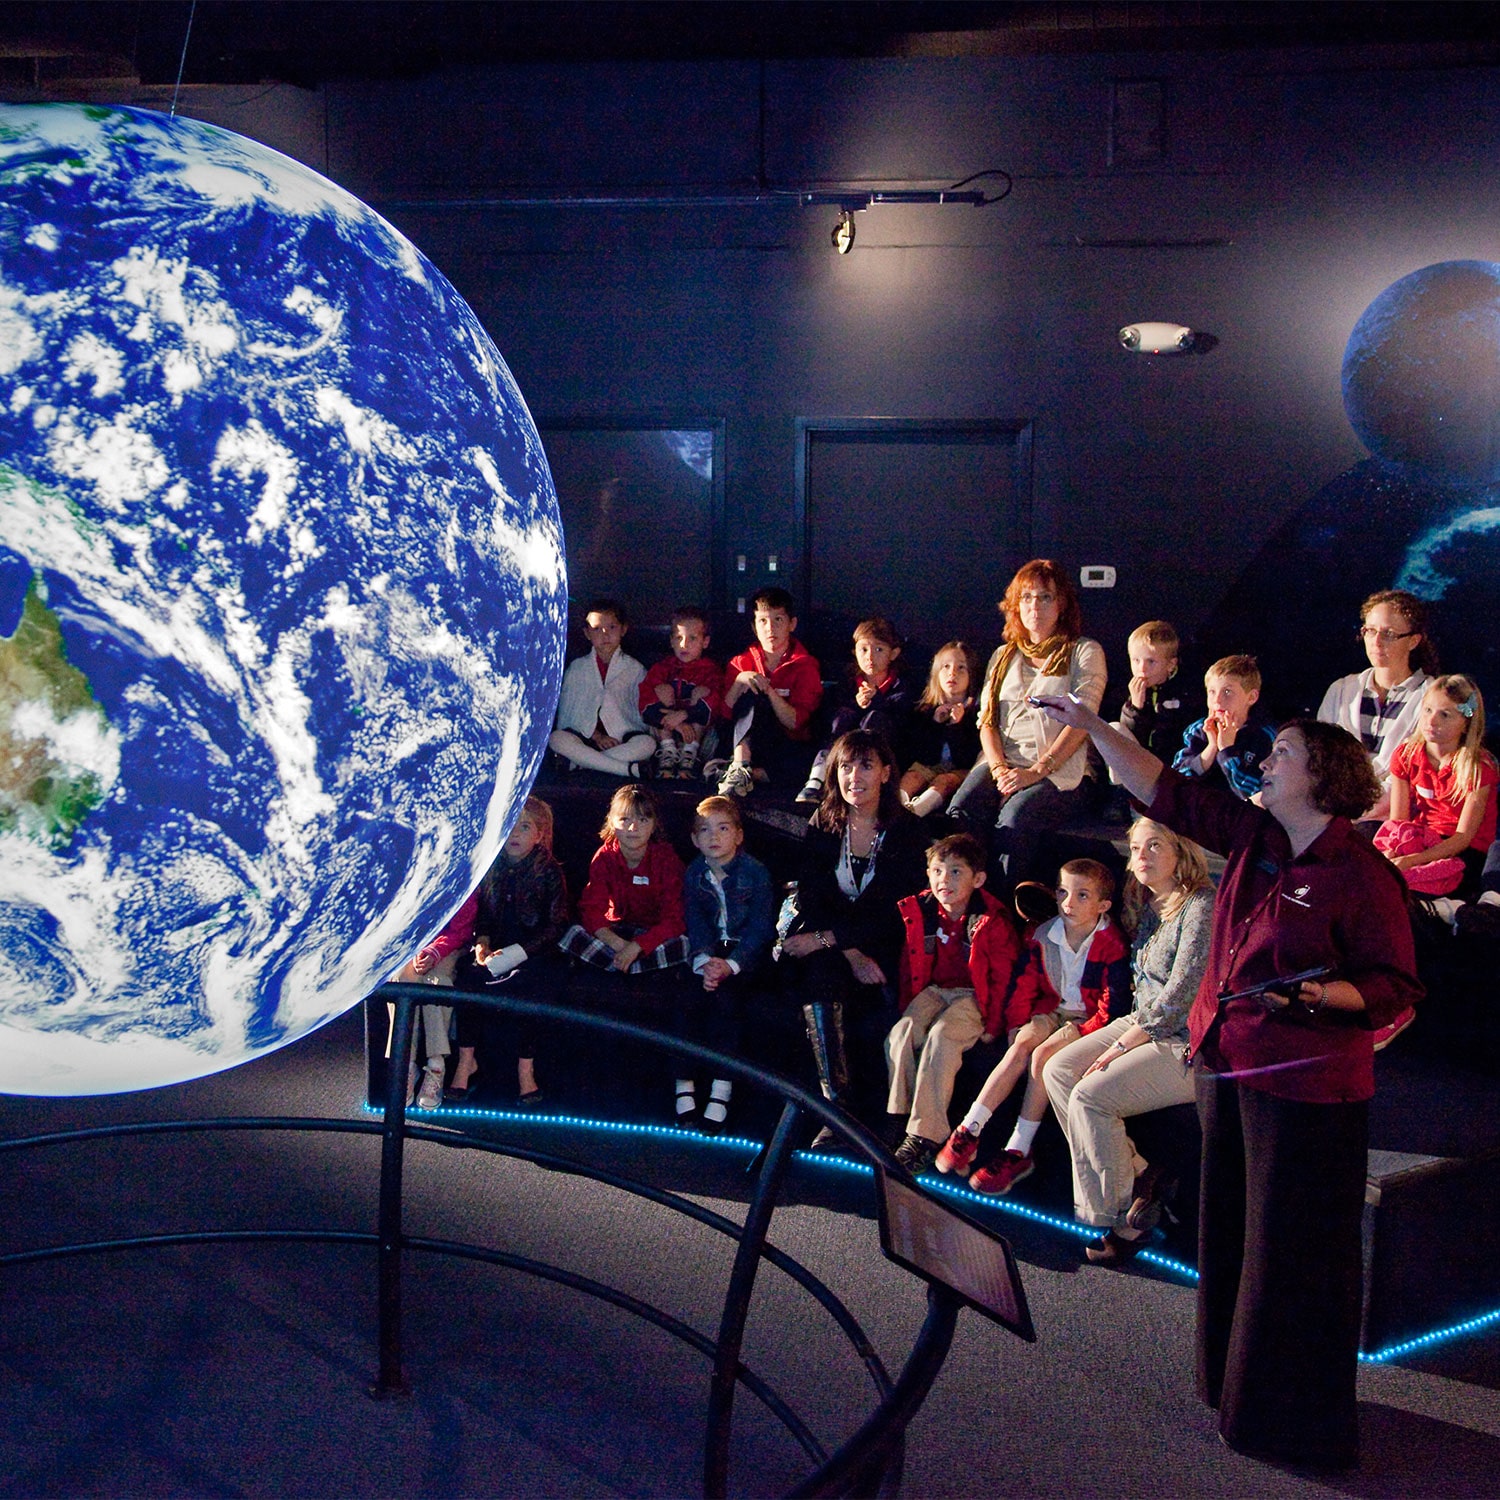
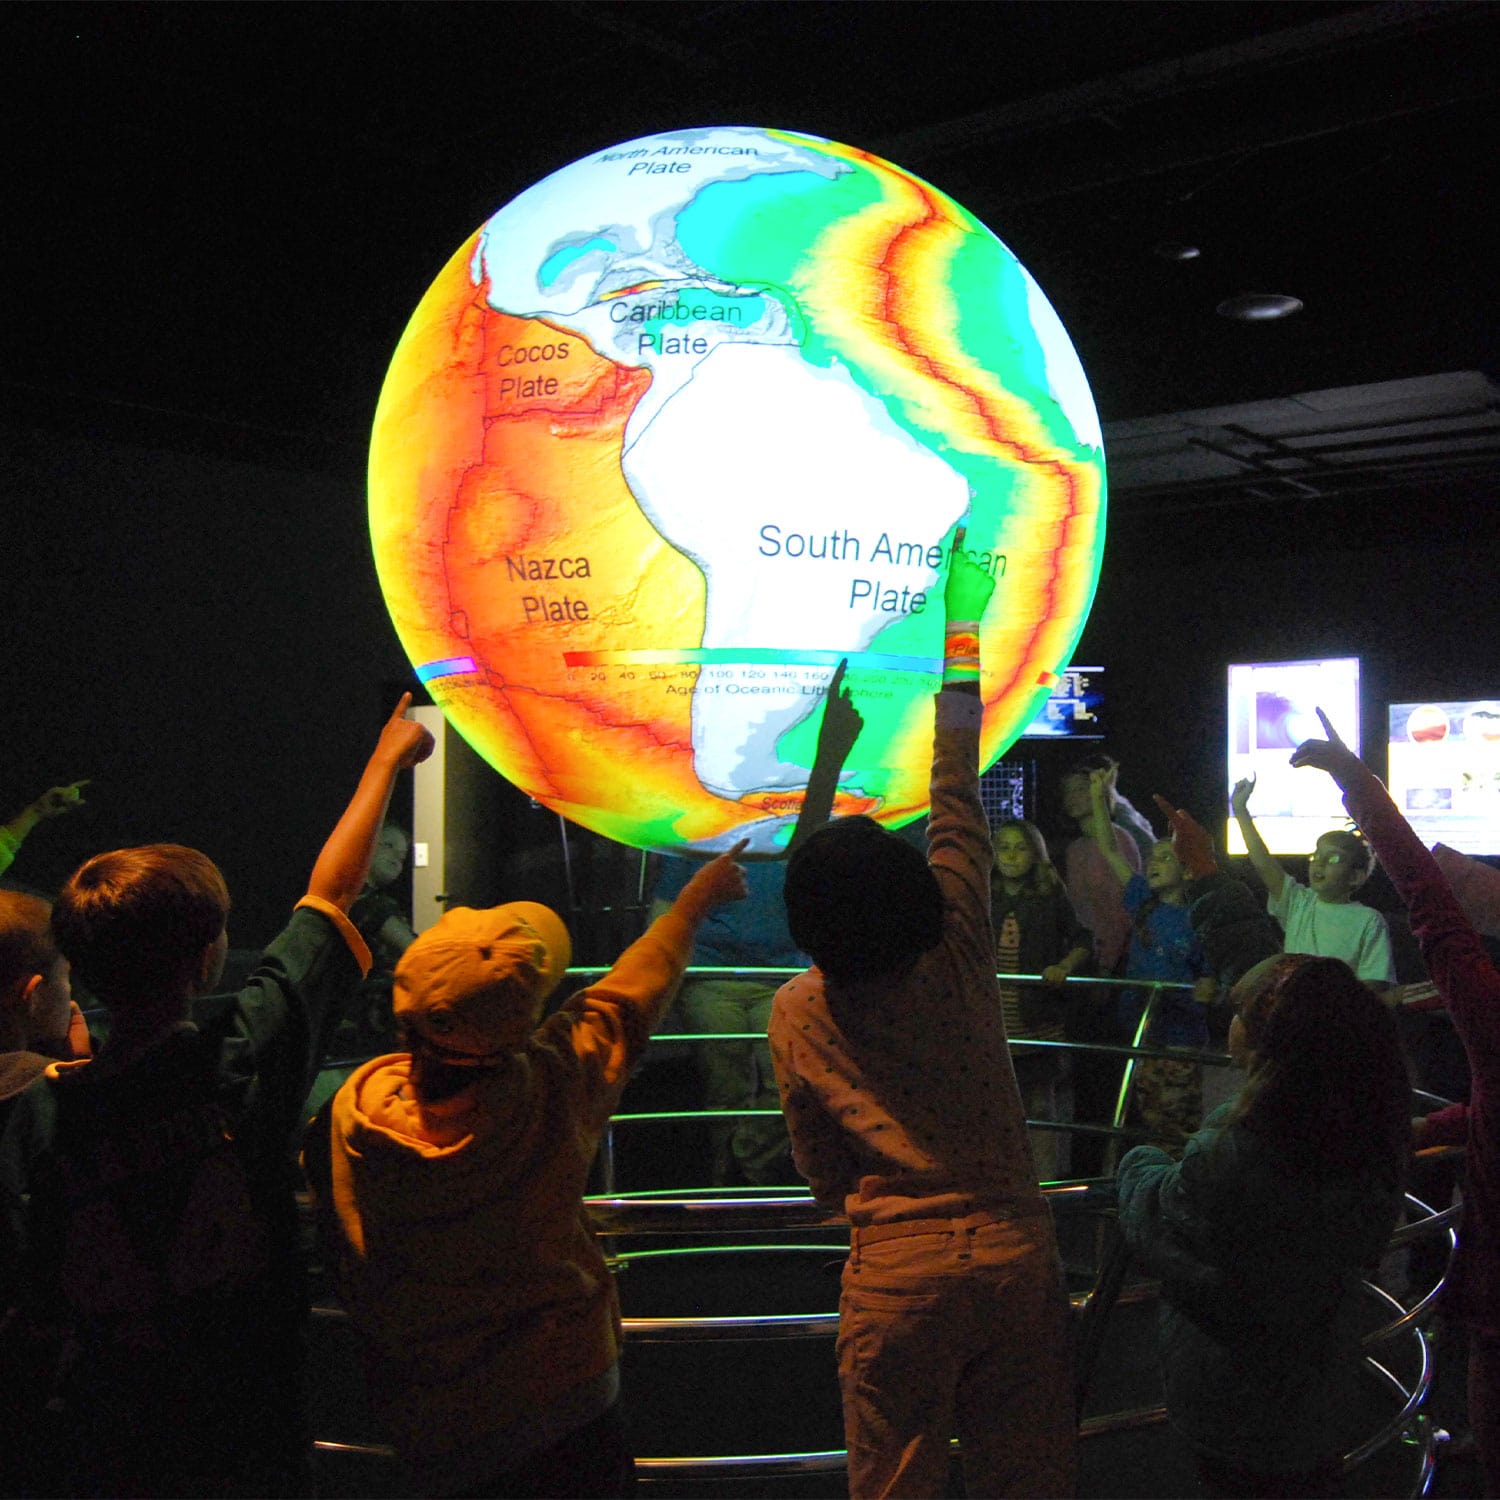
Researchers at NOAA developed Science On a Sphere® as an educational tool to help illustrate Earth System science to people of all ages. Animated images of atmospheric storms, climate change, and ocean temperature can be shown on the sphere, which is used to explain what are sometimes complex environmental processes, in a way that is simultaneously intuitive and captivating.
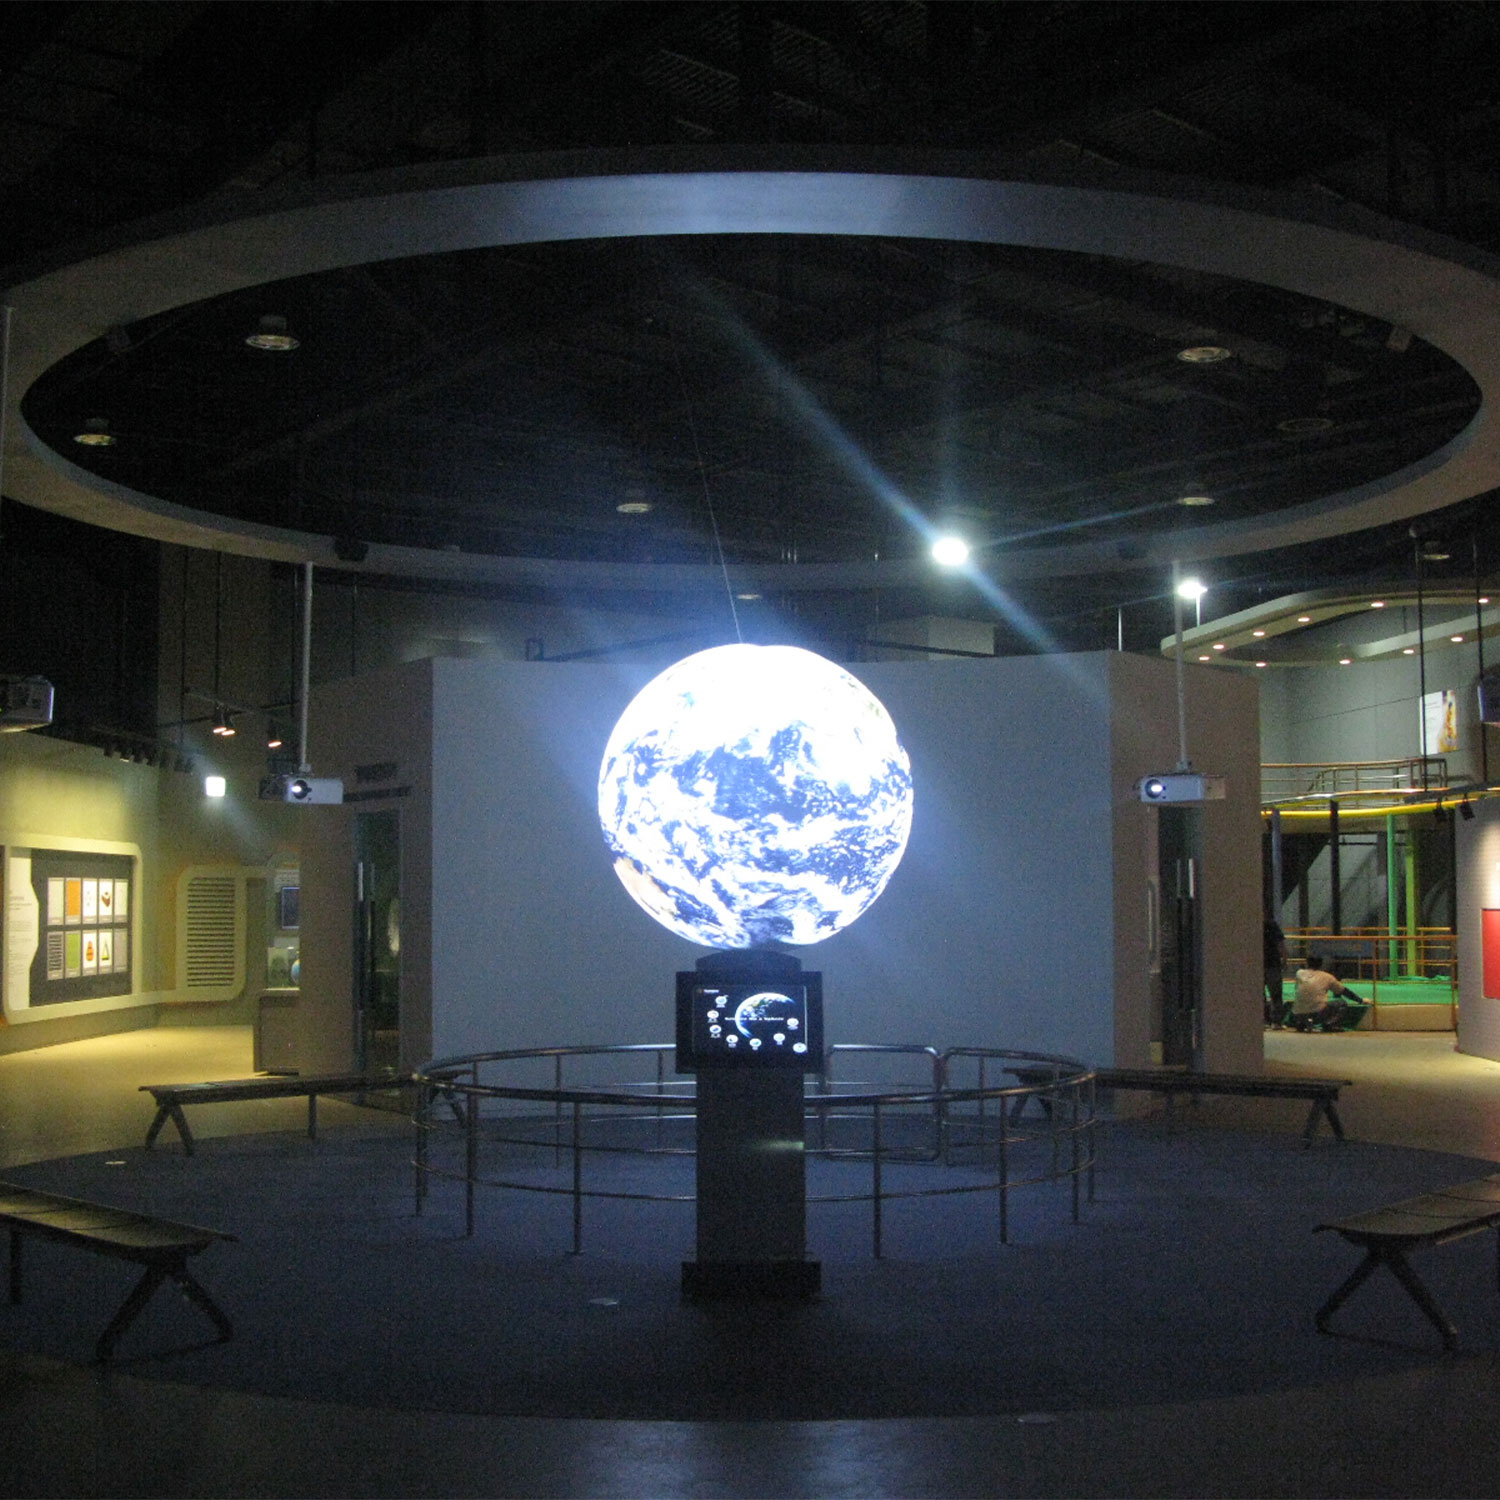
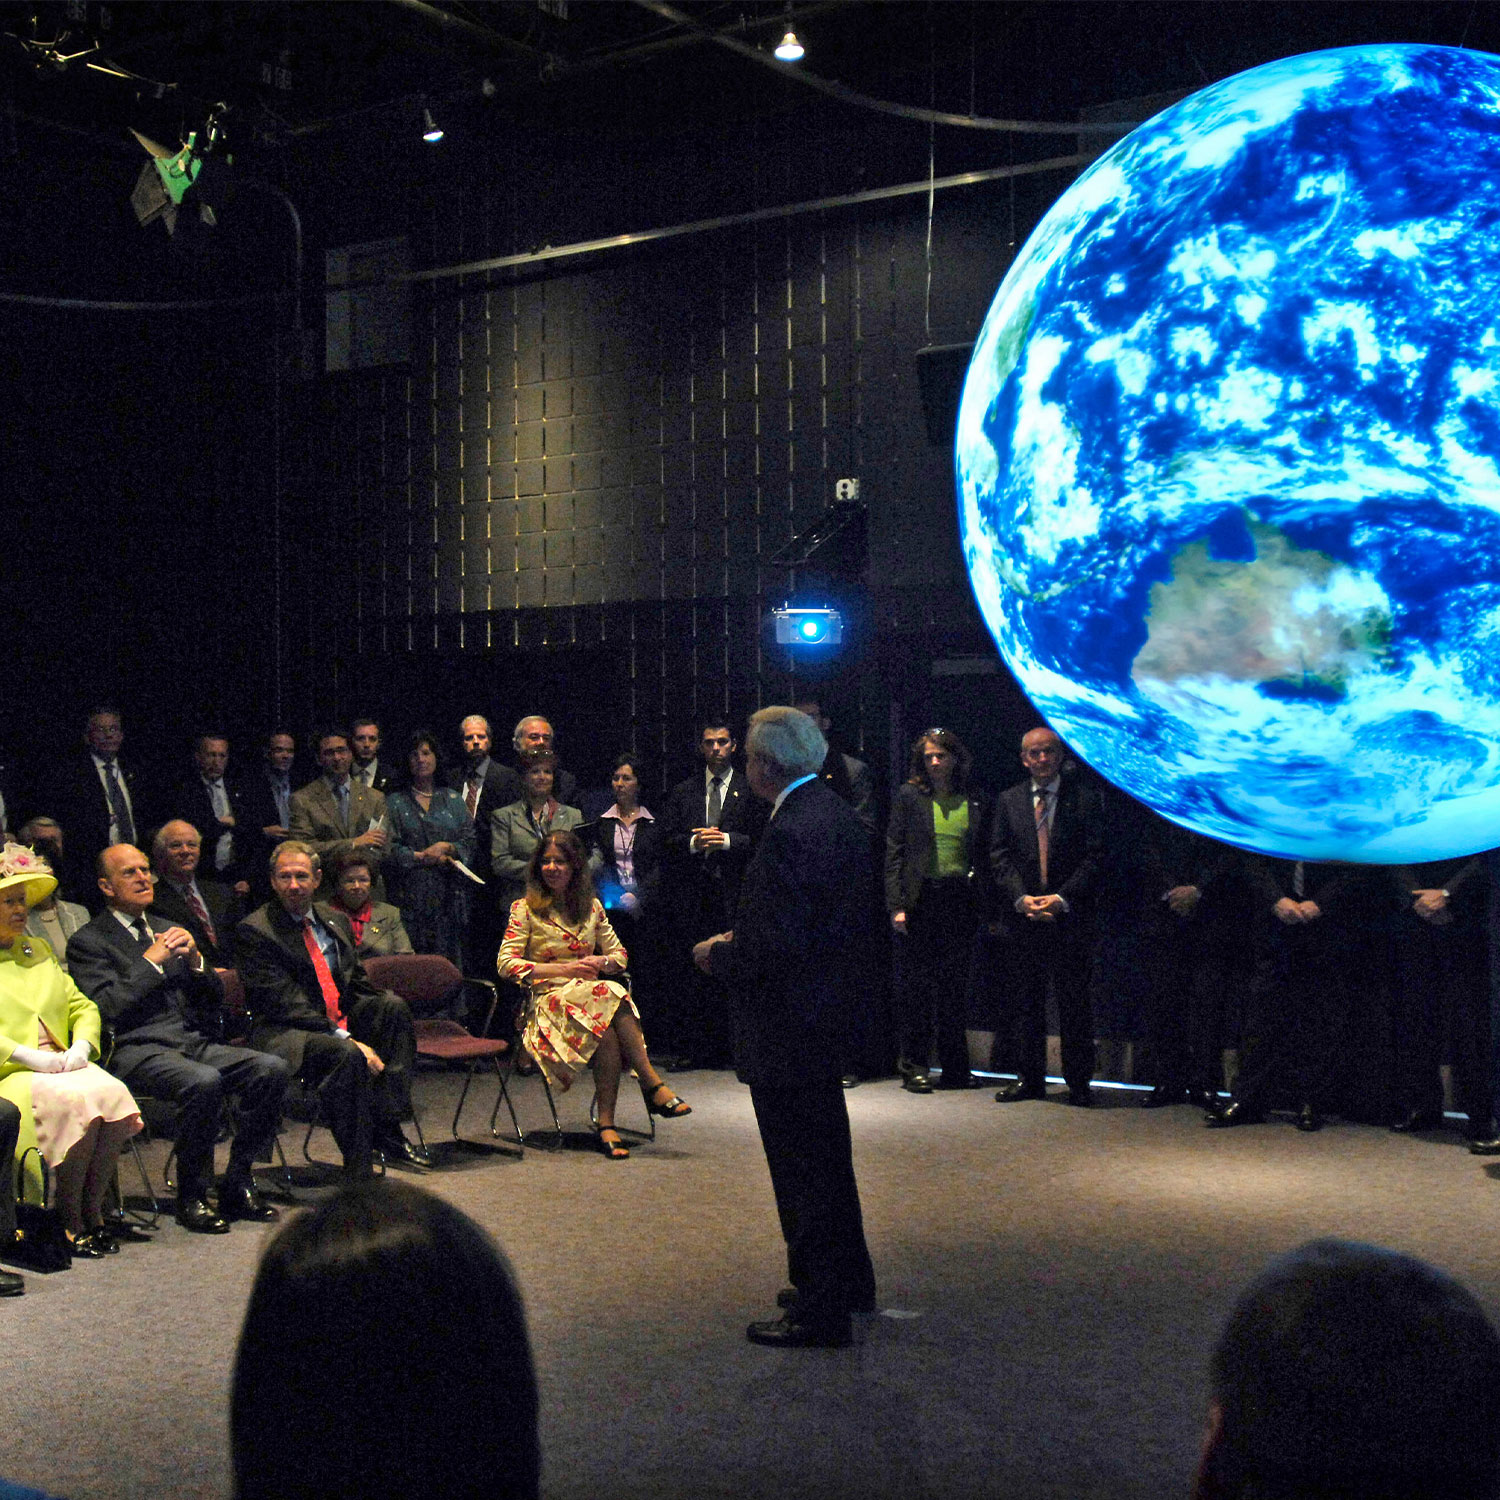
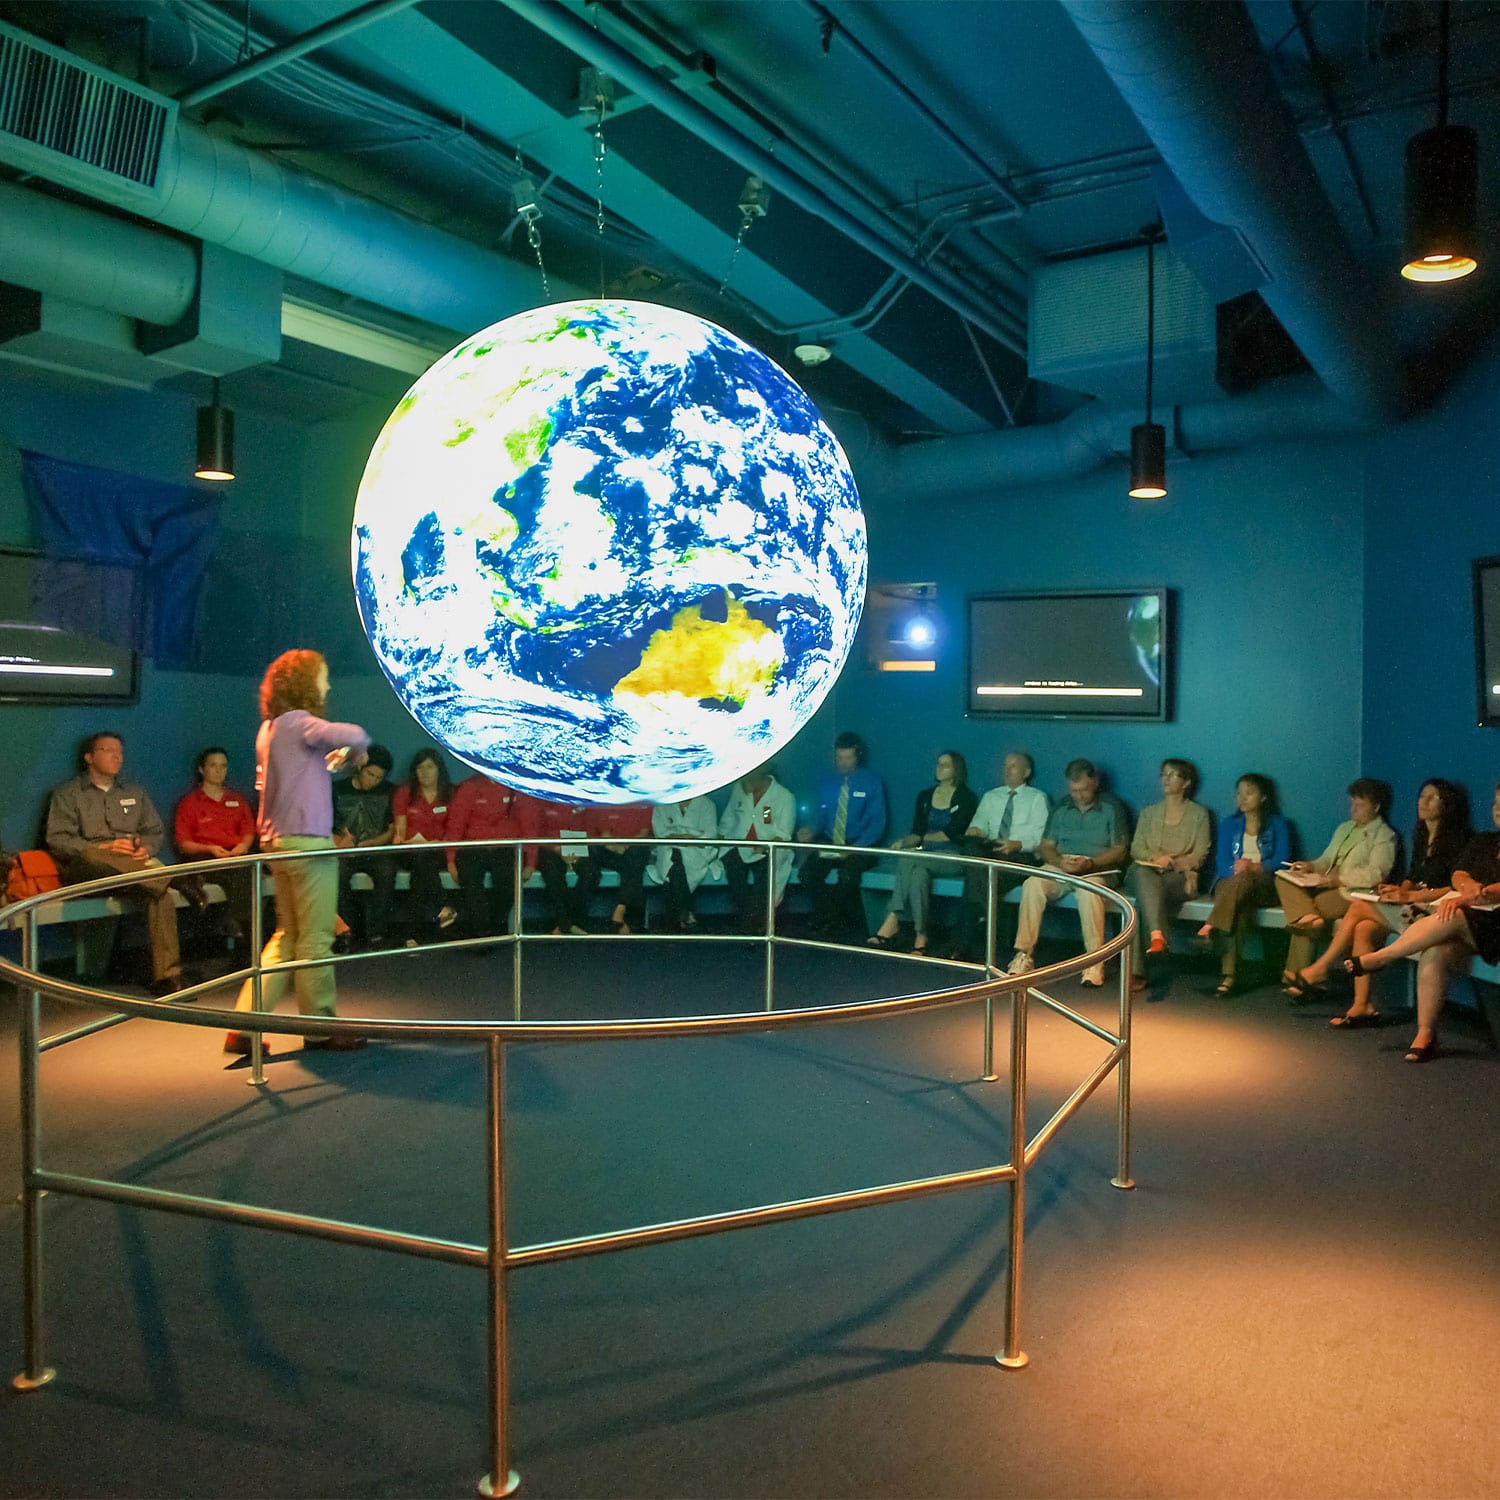
Science On a Sphere® extends NOAA’s educational program goals, which are designed to increase public understanding of the environment. Using NOAA’s collective experience and knowledge of the Earth’s land, oceans, and atmosphere, NOAA uses Science On a Sphere® as an instrument to enhance informal educational programs in science centres, universities, and museums across the country. Science On a Sphere® is available to any institution and is currently in operation at a number of facilities in the US.
Features
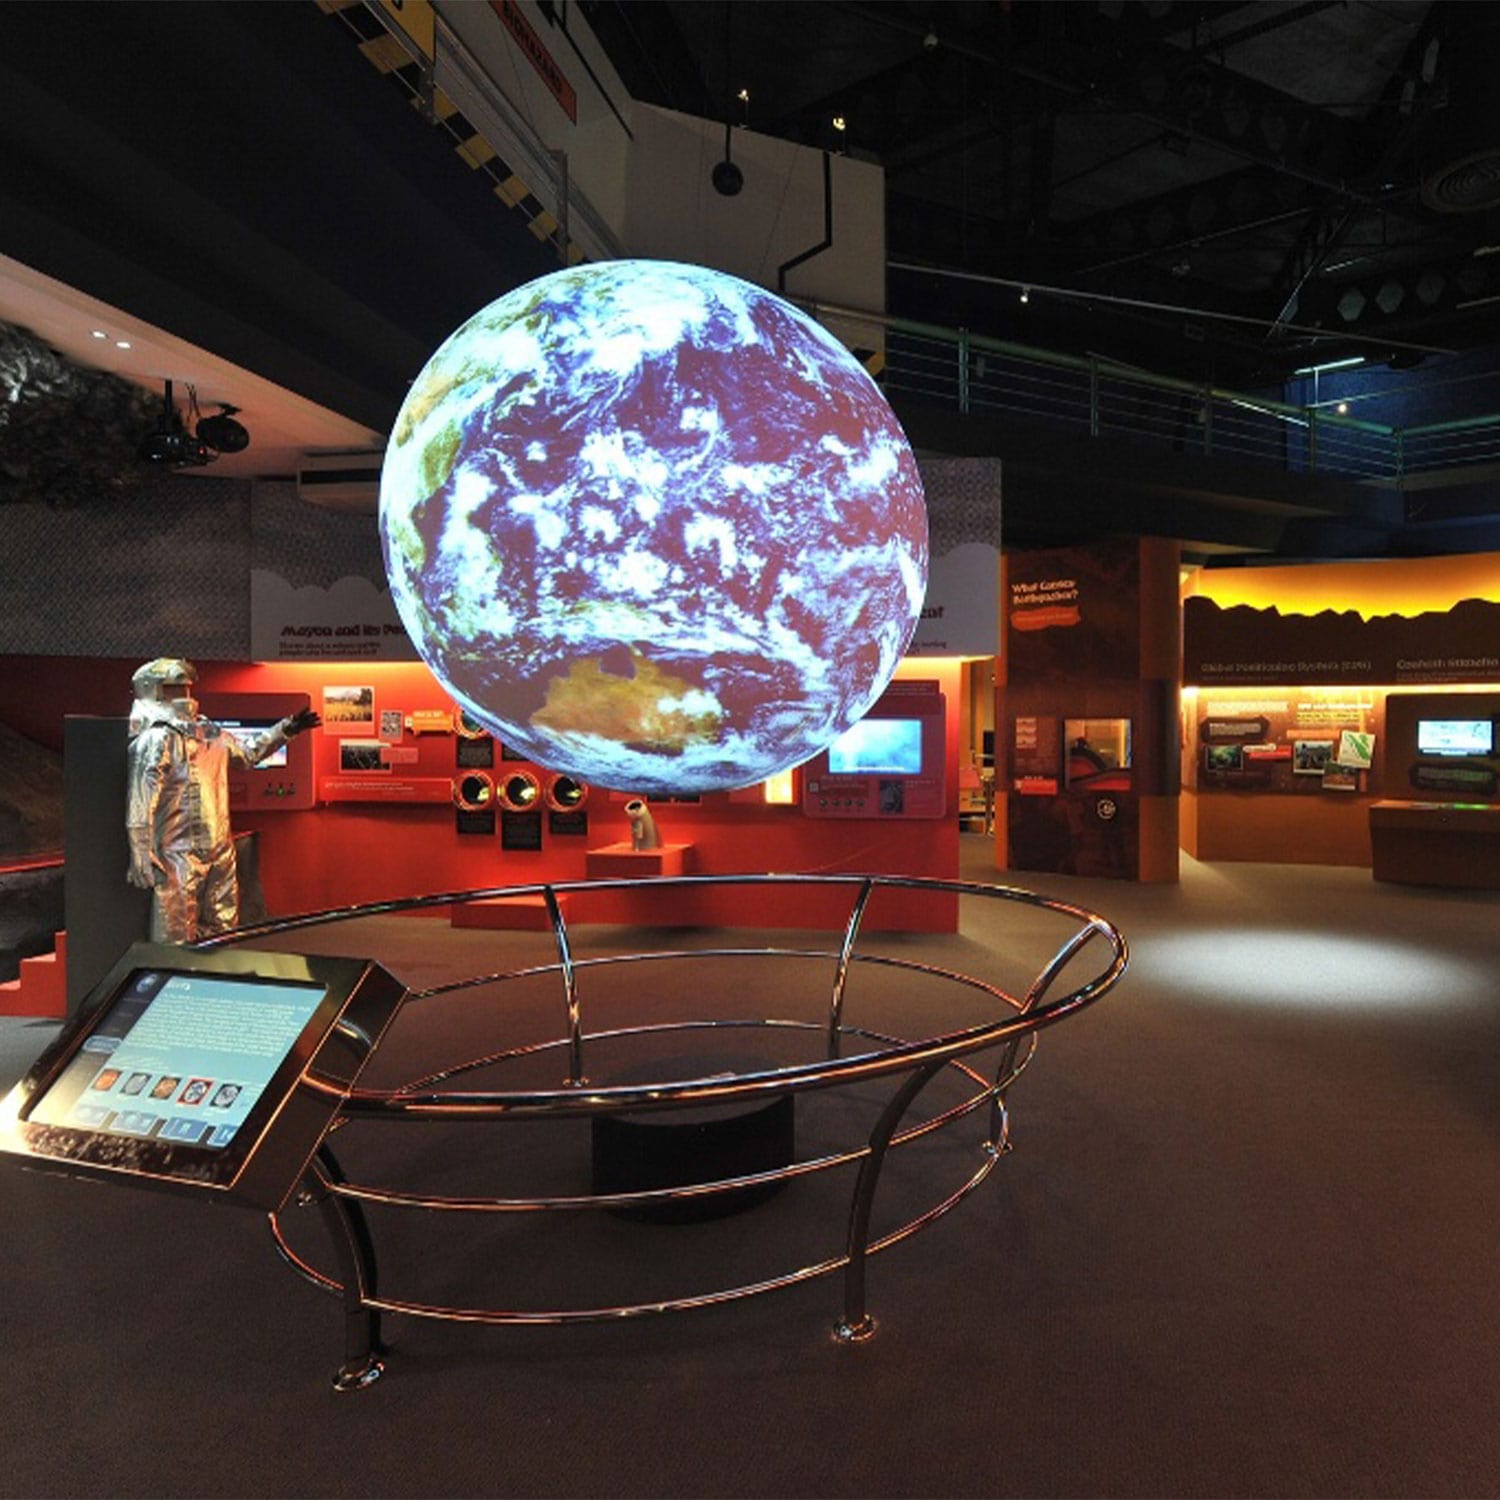
NOAA's Science On a Sphere® (SOS) is a room sized, global display system that uses computers and video projectors to display planetary data onto a six foot diameter sphere, analogous to a giant animated globe.
Data Catalog
Looking for the perfect dataset? The SOS data catalog has over 550 datasets, including 45 real-time datasets. Users get new datasets automatically at no additional cost. NOAA’s latest global models and observations from across all of the NOAA line offices can be found in the catalog.
iPad SOS Remote App
Want to give a SOS presentation? Navigate your way through presentations seamlessly with the SOS Remote App for iPads. The app includes access to the full data catalog, easy to use controls for showing the datasets, access to custom presentation playlists, a playlist builder to create your custom presentation playlists, and a variety of tools such as layering, drawing, and zoom, all at your fingertips!
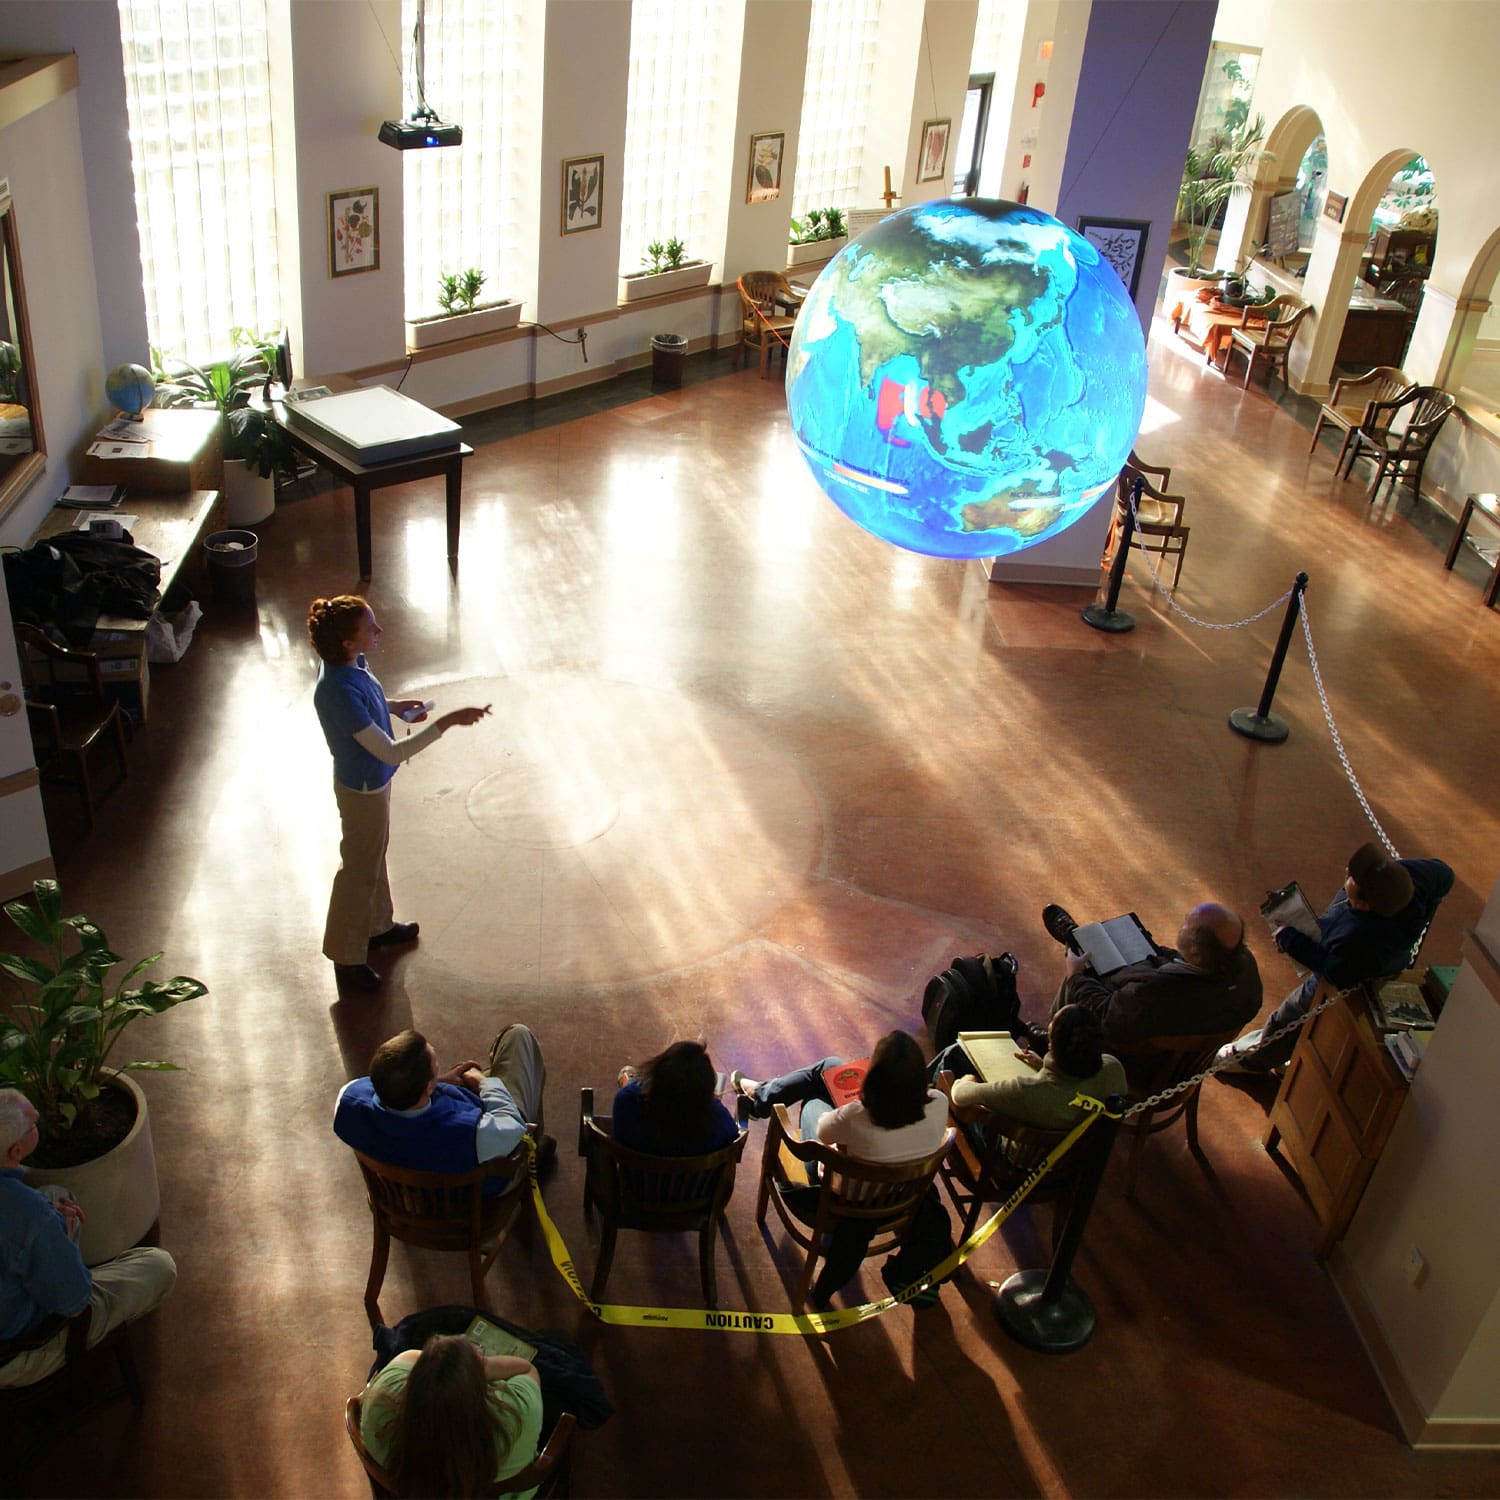
Live Programs
Not sure where to start? Want to see how others use SOS? Included with SOS are over 50 presentations with playlists and scripts called Live Programs already put together for you from NOAA and SOS educators.
Layers
Want to make meaningful connections? With the ability to layer datasets and control their opacity dynamically using the SOS Remote App, you can easily do that!
Splitter
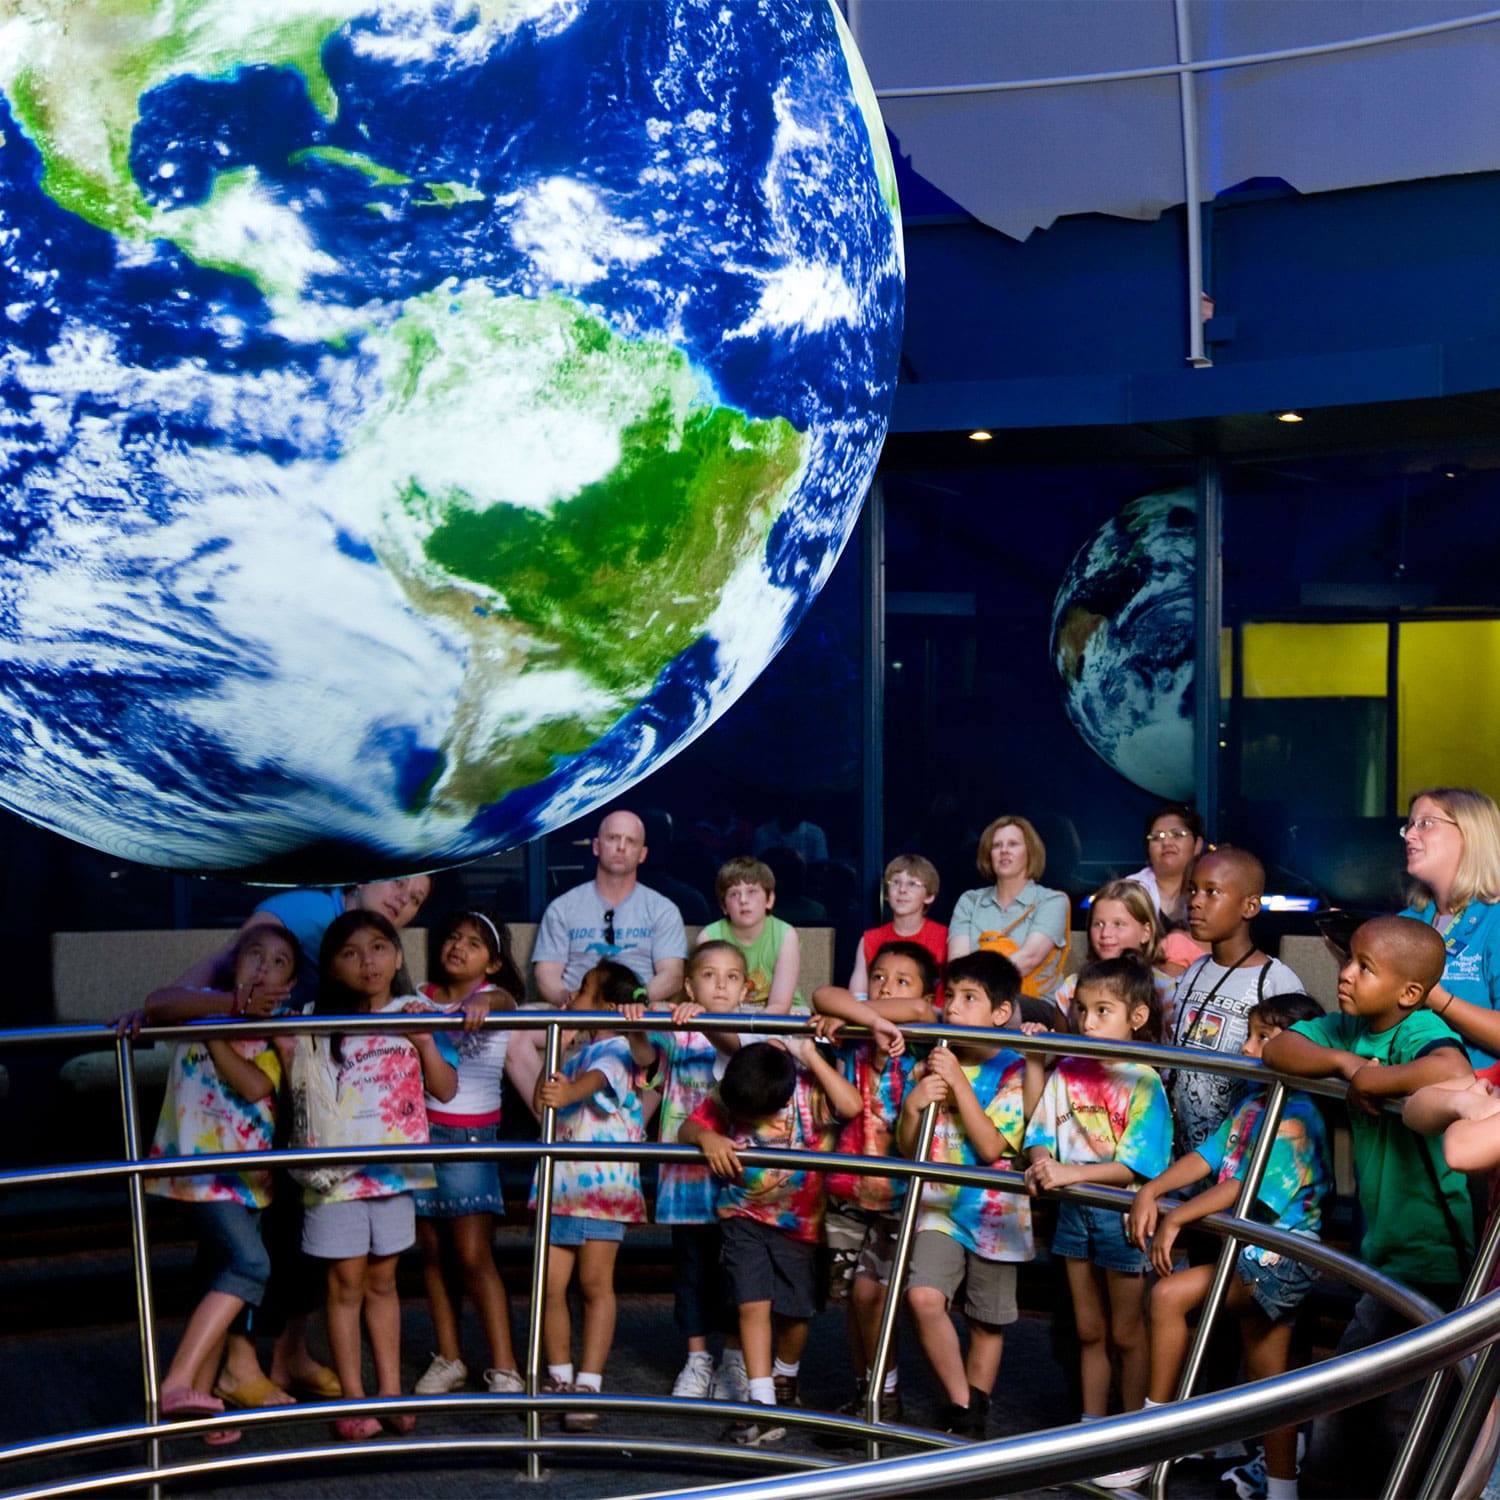
One challenge with a sphere is that visitors surrounding the sphere can't all see the same location that a presenter might be pointing to during a presentation. The solution? The splitter tool on the SOS Remote App! It allows you to dynamically split the sphere into 2, 3, or 4 slices so that everyone around the sphere gets to see the same data at the same time.
Zoom
NWant a closer look? Presenters can use a digital magnifying glass in the SOS Remote App to zoom into locations and see features in more detail.
Annotation
To help draw viewers' attention to the right locations, and to customize datasets on the fly, use the annotation tools on the SOS Remote App to add placemarks or draw onto the sphere!
Visual Playlist Editor
Have custom content you want to use? It’s easy to add with the Visual Playlist Editor! You can add custom content, modify existing datasets, and create your own presentation playlists with this intuitive software.
Text PIPs
Seeking to add context for your datasets? Text PIPs (picture-in-a-picture) give you the ability to add text onto the sphere that can serve as an explanation or a label or pose a thought provoking question. With support for multiple fonts, colors, and languages, the possibilities are endless!
SOS Public Kiosk
Want to give your visitors control? The SOS Public Kiosk lets you do just that! Completely customizable and easy for visitors to use, the kiosk lets visitors choose what they look at and explore the datasets on their own.
Translations
SOS can be found around the world, so we’ve written the SOS software to support multiple languages in most of the user interfaces, including the SOS Remote App, the SOS Public Kiosk, and the Visual Playlist Editor.
SOS Showcase
SOS Video Gallery
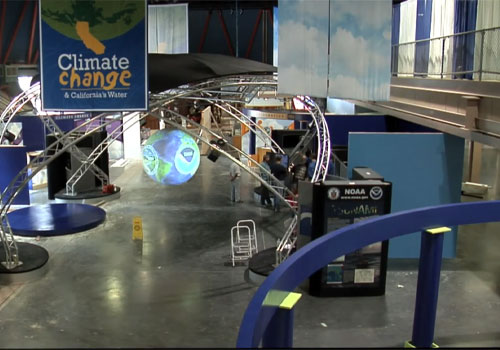
Science On a Sphere® Traveling Exhibit Time Lapse
This time lapse was filmed at the 2007 California State Fair during the set up of NOAA’s Science On a Sphere® at the exhibit for the CA Department of Water Resources and NOAA.
Inventor Dr. Sandy MacDonald Overview of the Earth System
SOS inventor Dr. Sandy MacDonald gives a brief overview of the Earth system using Science On a Sphere® in the David Himes Planet Theater, located in NOAA’s Earth System Research Laboratory in Boulder, CO.

Building Planet Adirondack
This time lapse was filmed by the Wild Center in 2012 during their installation of Science On a Sphere®. The Wild Center is located in the Adirondacks in Tupper Lake, NY. In this film, six hours are condensed into 5 minutes.
Celebrating 100 Science On a Spheres
In July 2013 the 100th Science On a Sphere was installed in Silver Spring, MD at NOAA headquarters.
Dr. Kathryn Sullivan on the 100th Installation of Science On a Sphere
The 100th NOAA Science On a Sphere was opened in November 2013 at NOAA’s headquarters in Silver Spring, MD.
NOAA Science On a Sphere
Sheikh Khalifa Marine Research Center, Umm Al Quwain

 Call
Call
 Mail
Mail